Time Magazine 2009 Annual Report Download - page 102
Download and view the complete annual report
Please find page 102 of the 2009 Time Magazine annual report below. You can navigate through the pages in the report by either clicking on the pages listed below, or by using the keyword search tool below to find specific information within the annual report.-
 1
1 -
2
-
3
-
4
-
5
-
6
-
7
-
8
-
9
-
10
-
11
-
12
-
13
-
14
-
15
-
16
-
17
-
18
-
19
-
20
-
21
-
22
-
23
-
24
-
25
-
26
-
27
-
28
-
29
-
30
-
31
-
32
-
33
-
34
-
35
-
36
-
37
-
38
-
39
-
40
-
41
-
42
-
43
-
44
-
45
-
46
-
47
-
48
-
49
-
50
-
51
-
52
-
53
-
54
-
55
-
56
-
57
-
58
-
59
-
60
-
61
-
62
-
63
-
64
-
65
-
66
-
67
-
68
-
69
-
70
-
71
-
72
-
73
-
74
-
75
-
76
-
77
-
78
-
79
-
80
-
81
-
82
-
83
-
84
-
85
-
86
-
87
-
88
-
89
-
90
-
91
-
 92
92 -
 93
93 -
 94
94 -
 95
95 -
 96
96 -
 97
97 -
 98
98 -
 99
99 -
 100
100 -
 101
101 -
 102
102 -
 103
103 -
 104
104 -
 105
105 -
 106
106 -
 107
107 -
 108
108 -
 109
109 -
 110
110 -
 111
111 -
 112
112 -
113
-
114
-
115
-
116
-
117
-
118
-
119
-
120
-
121
-
122
-
123
-
124
-
125
-
126
-
127
-
128
-
129
-
130
-
131
-
132
-
133
-
134
-
135
-
136
-
137
-
138
-
139
-
140
-
141
-
142
-
143
-
144
-
145
-
146
-
147
-
148
-
149
-
150
-
151
-
152
-
153
-
154
 |
 |

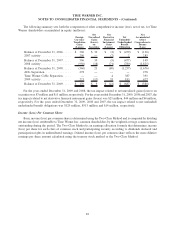
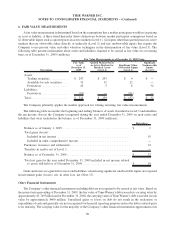
6. FAIR VALUE MEASUREMENTS
A fair value measurement is determined based on the assumptions that a market participant would use in pricing
an asset or liability. A three-tiered hierarchy draws distinctions between market participant assumptions based on
(i) observable inputs such as quoted prices in active markets (Level 1), (ii) inputs other than quoted prices in active
markets that are observable either directly or indirectly (Level 2) and (iii) unobservable inputs that require the
Company to use present value and other valuation techniques in the determination of fair value (Level 3). The
following table presents information about assets and liabilities required to be carried at fair value on a recurring
basis as of December 31, 2009 (millions):
Description
Fair Value
as of
December 31,
2009
Quoted Market Prices
in Active Markets for
Identical Assets
(Level 1)
Significant Other
Observable Inputs
(Level 2)
Significant
Unobservable
Inputs
(Level 3)
Fair Value Measurements as of December 31, 2009 Using
Assets:
Trading securities ........... $ 247 $ 243 $ 4 $ —
Available-for-sale securities .... 33 11 22 —
Derivatives ................ 45 5 8 32
Liabilities:
Derivatives ................ (91) — (91) —
Total ....................... $ 234 $ 259 $ (57) $ 32
The Company primarily applies the market approach for valuing recurring fair value measurements.
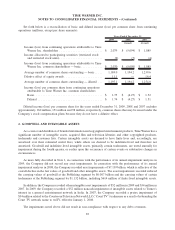
The following table reconciles the beginning and ending balances of assets classified as Level 3 and identifies
the net income (losses) the Company recognized during the year ended December 31, 2009 on such assets and
liabilities that were included in the balance as of December 31, 2009 (millions):
Derivatives
Balance as of January 1, 2009 . . . ..................................... $ 1
Total gains (losses):
Included in net income ............................................ 19
Included in other comprehensive income ............................... —
Purchases, issuances and settlements .................................... 12
Transfers in and/or out of Level 3. ..................................... —
Balance as of December 31, 2009 . ..................................... $ 32
Total net gain for the year ended December 31, 2009 included in net income related
to assets still held as of December 31, 2009 ............................ $ 19
Gains and losses recognized for assets and liabilities valued using significant unobservable inputs are reported
in investment gains (losses), net, in other loss, net (Note 17).
Other Financial Instruments
The Company’s other financial instruments including debt are not required to be carried at fair value. Based on
the interest rates prevailing at December 31, 2009, the fair value of Time Warner’s debt exceeds its carrying value by
approximately $1.749 billion and at December 31, 2008, the carrying value of Time Warner’s debt exceeded its fair
value by approximately $400 million. Unrealized gains or losses on debt do not result in the realization or
expenditure of cash and generally are not recognized for financial reporting purposes unless the debt is retired prior
to its maturity. The carrying value for the majority of the Company’s other financial instruments approximates fair
90
TIME WARNER INC.
NOTES TO CONSOLIDATED FINANCIAL STATEMENTS – (Continued)