Time Magazine 2009 Annual Report Download - page 50
Download and view the complete annual report
Please find page 50 of the 2009 Time Magazine annual report below. You can navigate through the pages in the report by either clicking on the pages listed below, or by using the keyword search tool below to find specific information within the annual report.-
 1
1 -
2
-
3
-
4
-
5
-
6
-
7
-
8
-
9
-
10
-
11
-
12
-
13
-
14
-
15
-
16
-
17
-
18
-
19
-
20
-
21
-
22
-
23
-
24
-
25
-
26
-
27
-
28
-
29
-
30
-
31
-
32
-
33
-
34
-
35
-
36
-
37
-
38
-
39
-
 40
40 -
 41
41 -
 42
42 -
 43
43 -
 44
44 -
 45
45 -
 46
46 -
 47
47 -
 48
48 -
 49
49 -
 50
50 -
 51
51 -
 52
52 -
 53
53 -
 54
54 -
 55
55 -
 56
56 -
 57
57 -
 58
58 -
 59
59 -
 60
60 -
61
-
62
-
63
-
64
-
65
-
66
-
67
-
68
-
69
-
70
-
71
-
72
-
73
-
74
-
75
-
76
-
77
-
78
-
79
-
80
-
81
-
82
-
83
-
84
-
85
-
86
-
87
-
88
-
89
-
90
-
91
-
92
-
93
-
94
-
95
-
96
-
97
-
98
-
99
-
100
-
101
-
102
-
103
-
104
-
105
-
106
-
107
-
108
-
109
-
110
-
111
-
112
-
113
-
114
-
115
-
116
-
117
-
118
-
119
-
120
-
121
-
122
-
123
-
124
-
125
-
126
-
127
-
128
-
129
-
130
-
131
-
132
-
133
-
134
-
135
-
136
-
137
-
138
-
139
-
140
-
141
-
142
-
143
-
144
-
145
-
146
-
147
-
148
-
149
-
150
-
151
-
152
-
153
-
154
 |
 |

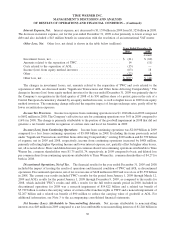
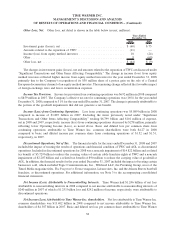
Other Loss, Net. Other loss, net detail is shown in the table below (recast, millions):
2008 2007
Years Ended
December 31,
Investment gains (losses), net ...................................... $ (60) $ 75
Amounts related to the separation of TWC ............................ (11) —
Income (loss) from equity method investees ........................... 18 (24)
Other ........................................................ 9 (60)
Other loss, net ................................................. $ (44) $ (9)
The changes in investment gains (losses), net and amounts related to the separation of TWC are discussed under
“Significant Transactions and Other Items Affecting Comparability.” The change in income (loss) from equity
method investees reflected higher income from equity method investees for the year ended December 31, 2008
primarily due to the Company’s recognition of its $30 million share of a pretax gain on the sale of a Central
European documentary channel of an equity method investee. The remaining change reflected the favorable impact
of foreign exchange rates and lower securitization expenses.
Income Tax Provision. Income tax provision from continuing operations was $692 million in 2008 compared
to $859 million in 2007. The Company’s effective tax rate for continuing operations was (16%) for the year ended
December 31, 2008 compared to 31% for the year ended December 31, 2007. The change is primarily attributable to
the portion of the goodwill impairments that did not generate a tax benefit.
Income (Loss) from Continuing Operations. Loss from continuing operations was $5.089 billion in 2008
compared to income of $1.887 billion in 2007. Excluding the items previously noted under “Significant
Transactions and Other Items Affecting Comparability” totaling $6.799 billion and $101 million of expense,
net in 2008 and 2007, respectively, income (loss) from continuing operations decreased by $278 million, primarily
reflecting lower Operating Income (Loss), as noted above. Basic and diluted loss per common share from
continuing operations attributable to Time Warner Inc. common shareholders were both $4.27 in 2008
compared to basic and diluted income per common share from continuing operations of $1.52 and $1.51,
respectively, in 2007.
Discontinued Operations, Net of Tax. The financial results for the years ended December 31, 2008 and 2007
included the impact of treating the results of operations and financial condition of TWC and AOL as discontinued
operations. Included in discontinued operations for 2008 was a noncash impairment of $14.822 billion and a related
tax benefit of $5.729 billion to reduce the carrying values of certain cable franchise rights at TWC and a noncash
impairment of $2.207 billion and a related tax benefit of $90 million to reduce the carrying value of goodwill at
AOL. In addition, the financial results for the year ended December 31, 2007 included the impact of treating certain
businesses sold, which included Tegic Communications, Inc., Wildseed LLC, the Parenting Group, most of the
Time4 Media magazine titles, The Progressive Farmer magazine, Leisure Arts, Inc. and the Atlanta Braves baseball
franchise, as discontinued operations. For additional information, see Note 3 to the accompanying consolidated
financial statements.
Net Income (Loss) Attributable to Noncontrolling Interests. Time Warner had $1.246 billion of net loss
attributable to noncontrolling interests in 2008 compared to net income attributable to noncontrolling interests of
$240 million in 2007 of which a $1.251 billion loss and $242 million of income, respectively, were attributable to
discontinued operations.
Net Income (Loss) Attributable to Time Warner Inc. shareholders. Net loss attributable to Time Warner Inc.
common shareholders was $13.402 billion in 2008 compared to net income attributable to Time Warner Inc.
shareholders of $4.387 billion in 2007. Basic and diluted net loss per common share attributable to Time Warner
38
TIME WARNER INC.
MANAGEMENT’S DISCUSSION AND ANALYSIS
OF RESULTS OF OPERATIONS AND FINANCIAL CONDITION – (Continued)