Time Magazine 2009 Annual Report Download - page 115
Download and view the complete annual report
Please find page 115 of the 2009 Time Magazine annual report below. You can navigate through the pages in the report by either clicking on the pages listed below, or by using the keyword search tool below to find specific information within the annual report.-
 1
1 -
2
-
3
-
4
-
5
-
6
-
7
-
8
-
9
-
10
-
11
-
12
-
13
-
14
-
15
-
16
-
17
-
18
-
19
-
20
-
21
-
22
-
23
-
24
-
25
-
26
-
27
-
28
-
29
-
30
-
31
-
32
-
33
-
34
-
35
-
36
-
37
-
38
-
39
-
40
-
41
-
42
-
43
-
44
-
45
-
46
-
47
-
48
-
49
-
50
-
51
-
52
-
53
-
54
-
55
-
56
-
57
-
58
-
59
-
60
-
61
-
62
-
63
-
64
-
65
-
66
-
67
-
68
-
69
-
70
-
71
-
72
-
73
-
74
-
75
-
76
-
77
-
78
-
79
-
80
-
81
-
82
-
83
-
84
-
85
-
86
-
87
-
88
-
89
-
90
-
91
-
92
-
93
-
94
-
95
-
96
-
97
-
98
-
99
-
100
-
101
-
102
-
103
-
104
-
 105
105 -
 106
106 -
 107
107 -
 108
108 -
 109
109 -
 110
110 -
 111
111 -
 112
112 -
 113
113 -
 114
114 -
 115
115 -
 116
116 -
 117
117 -
 118
118 -
 119
119 -
 120
120 -
 121
121 -
 122
122 -
 123
123 -
 124
124 -
 125
125 -
126
-
127
-
128
-
129
-
130
-
131
-
132
-
133
-
134
-
135
-
136
-
137
-
138
-
139
-
140
-
141
-
142
-
143
-
144
-
145
-
146
-
147
-
148
-
149
-
150
-
151
-
152
-
153
-
154
 |
 |

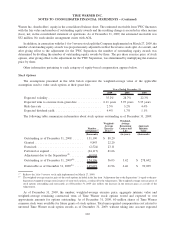
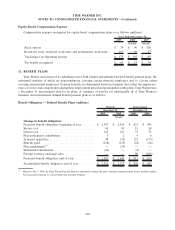
forfeitures, is $81 million and is expected to be recognized over a weighted-average period between one and two
years.
The weighted-average fair value of a Time Warner stock option granted during the years ended December 31,
2009, 2008 and 2007 was $5.07 ($3.14, net of tax), $12.30 ($7.63, net of tax) and $15.45 ($9.58, net of tax),
respectively. The total intrinsic value of Time Warner options exercised during the years ended December 31, 2009,
2008 and 2007 was $13 million, $53 million and $313 million, respectively. Cash received from the exercise of
Time Warner stock options was $56 million, $134 million and $521 million for the years ended December 31, 2009,
2008 and 2007, respectively. The tax benefits realized from Time Warner stock options exercised in the years ended
December 31, 2009, 2008 and 2007 were $5 million, $20 million and $119 million, respectively.
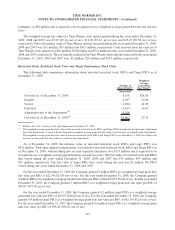
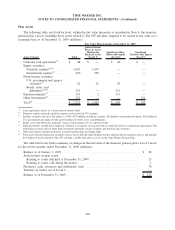
Restricted Stock, Restricted Stock Units and Target Performance Stock Units
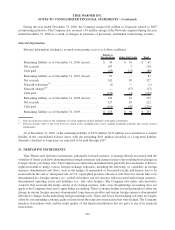
The following table summarizes information about unvested restricted stock, RSUs and Target PSUs as of
December 31, 2009:
Number of
Shares/Units
(a)
Weighted-
Average
Grant Date
Fair Value
(a)
(thousands)
Unvested as of December 31, 2008 ............................ 8,158 $51.81
Granted ................................................ 4,947 22.40
Vested ................................................. (1,850) 41.87
Forfeited ............................................... (1,817) 34.53
Adjustment due to the Separations
(b)
........................... 5,024
Unvested as of December 31, 2009
(b)
.......................... 14,462 27.15
(a)
Reflects the 1-for-3 reverse stock split implemented on March 27, 2009.
(b)
The weighted-average grant date fair value of the unvested restricted stock, RSUs and Target PSUs included in the line item “Adjustment
due to the Separations” is equal to the pre-Separation weighted-average grant date fair value of such awards, as reduced by the Adjustments.
The weighted-average grant date fair value of unvested restricted stock, RSUs and Target PSUs as of December 31, 2009 also reflects the
decrease in the grant-date fair value as a result of the Adjustments.
As of December 31, 2009, the intrinsic value of unvested restricted stock, RSUs and target PSUs was
$421 million. Total unrecognized compensation cost related to unvested restricted stock, RSUs and Target PSUs as
of December 31, 2009, without taking into account expected forfeitures, was $137 million and is expected to be
recognized over a weighted-average period between one and two years. The fair value of restricted stock and RSUs
that vested during the years ended December 31, 2009, 2008 and 2007 was $76 million, $59 million and
$53 million, respectively. The fair value of target PSUs that vested during the year was $2 million. No PSUs
vested during the years ended December 31, 2008 and 2007.
For the year ended December 31, 2009, the Company granted 5 million RSUs at a weighted-average grant date
fair value per RSU of $22.34 ($13.85 net of tax). For the year ended December 31, 2008, the Company granted
4 million RSUs at a weighted-average grant date fair value per RSU of $44.49 ($27.58 net of tax). For the year ended
December 31, 2007, the Company granted 3 million RSUs at a weighted-average grant date fair value per RSU of
$59.67 ($37.00 net of tax).
For the year ended December 31, 2009, the Company granted 0.2 million target PSUs at a weighted-average
grant date fair value per PSU of $23.67 ($14.68 net of tax). For the year ended December 31, 2008, the Company
granted 0.4 million target PSUs at a weighted-average grant date fair value per PSU of $52.59 ($32.61 net of tax).
For the year ended December 31, 2007, the Company granted 0.4 million target PSUs at a weighted-average grant
date fair value per PSU of $58.41 ($36.21 net of tax).
103
TIME WARNER INC.
NOTES TO CONSOLIDATED FINANCIAL STATEMENTS – (Continued)