The Hartford 2011 Annual Report Download - page 95
Download and view the complete annual report
Please find page 95 of the 2011 The Hartford annual report below. You can navigate through the pages in the report by either clicking on the pages listed below, or by using the keyword search tool below to find specific information within the annual report.-
 1
1 -
2
-
3
-
4
-
5
-
6
-
7
-
8
-
9
-
10
-
11
-
12
-
13
-
14
-
15
-
16
-
17
-
18
-
19
-
20
-
21
-
22
-
23
-
24
-
25
-
26
-
27
-
28
-
29
-
30
-
31
-
32
-
33
-
34
-
35
-
36
-
37
-
38
-
39
-
40
-
41
-
42
-
43
-
44
-
45
-
46
-
47
-
48
-
49
-
50
-
51
-
52
-
53
-
54
-
55
-
56
-
57
-
58
-
59
-
60
-
61
-
62
-
63
-
64
-
65
-
66
-
67
-
68
-
69
-
70
-
71
-
72
-
73
-
74
-
75
-
76
-
77
-
78
-
79
-
80
-
81
-
82
-
83
-
84
-
 85
85 -
 86
86 -
 87
87 -
 88
88 -
 89
89 -
 90
90 -
 91
91 -
 92
92 -
 93
93 -
 94
94 -
 95
95 -
 96
96 -
 97
97 -
 98
98 -
 99
99 -
 100
100 -
 101
101 -
 102
102 -
 103
103 -
 104
104 -
 105
105 -
106
-
107
-
108
-
109
-
110
-
111
-
112
-
113
-
114
-
115
-
116
-
117
-
118
-
119
-
120
-
121
-
122
-
123
-
124
-
125
-
126
-
127
-
128
-
129
-
130
-
131
-
132
-
133
-
134
-
135
-
136
-
137
-
138
-
139
-
140
-
141
-
142
-
143
-
144
-
145
-
146
-
147
-
148
-
149
-
150
-
151
-
152
-
153
-
154
-
155
-
156
-
157
-
158
-
159
-
160
-
161
-
162
-
163
-
164
-
165
-
166
-
167
-
168
-
169
-
170
-
171
-
172
-
173
-
174
-
175
-
176
-
177
-
178
-
179
-
180
-
181
-
182
-
183
-
184
-
185
-
186
-
187
-
188
-
189
-
190
-
191
-
192
-
193
-
194
-
195
-
196
-
197
-
198
-
199
-
200
-
201
-
202
-
203
-
204
-
205
-
206
-
207
-
208
-
209
-
210
-
211
-
212
-
213
-
214
-
215
-
216
-
217
-
218
-
219
-
220
-
221
-
222
-
223
-
224
-
225
-
226
-
227
-
228
-
229
-
230
-
231
-
232
-
233
-
234
-
235
-
236
-
237
-
238
-
239
-
240
-
241
-
242
-
243
-
244
-
245
-
246
-
247
-
248
 |
 |
95
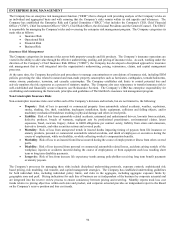
Natural Catastrophe Risk
Natural catastrophe risk is defined as the exposure arising from natural phenomena (e.g., weather, earthquakes, wildfires, etc.) that
create a concentration or aggregation of loss across the Company’ s insurance or asset portfolios. The Company uses both internal and
third-party models to estimate the potential loss resulting from various catastrophe events and the potential financial impact those events
would have on the Company’s financial position and results of operations across the property-casualty, life, and asset management
businesses. For natural catastrophe perils, the Company generally limits its estimated pre-tax loss as a result of natural catastrophes for
property & casualty exposures from a single 250-year event to less than 30% of statutory surplus prior to reinsurance and to less than
15% of statutory surplus after reinsurance. The Company’ s modeled loss estimates are derived by averaging 21 modeled loss events
representing a 250-year return period loss. For the peril of earthquake, the 21 events averaged to determine the modeled loss estimate
include events occurring in California as well as the Northeastern, Southeastern and Midwestern regions of the United States with
associated magnitudes ranging from 5.9 to 7.7 on the Moment Magnitude scale. For the peril of hurricane, the 21 events averaged to
determine the modeled loss estimate include category 3, 4 and 5 events in Florida, as well as other Gulf and Northeastern region
landfalls.
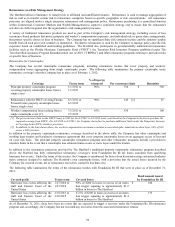
While Enterprise Risk Management has a process to track and manage these limits, from time to time, the estimated loss to natural
catastrophes from a single 250-year event prior to reinsurance may fluctuate above or below these limits due to changes in modeled loss
estimates, exposures, or statutory surplus. Currently, the Company's estimated pre-tax loss to a single 250-year natural catastrophe
event prior to reinsurance is less than 30% of the statutory surplus of the property and casualty insurance subsidiaries and the
Company’ s estimated pre-tax loss net of reinsurance is less than 15% of statutory surplus of the property and casualty operations. The
estimated 250 year pre-tax probable maximum losses from hurricane events are estimated to be $1.7 billion and $632, before and after
reinsurance, respectively. The estimated 250 year pre-tax probable maximum loss from earthquake events is estimated to be $793
before reinsurance and $482 net of reinsurance. The loss estimates represent total property losses for hurricane events and property and
workers’ compensation losses for earthquake events resulting from a single event. The estimates provided are based on 250-year return
period loss estimates that have a 0.4% likelihood of being exceeded in any single year.
The net loss estimates provided above assume that the Company is able to recover all losses ceded to reinsurers under its reinsurance
programs. There are various methodologies used in the industry to estimate the potential property and workers’ compensation losses that
would arise from various catastrophe events and companies may use different models and assumptions in their estimates. Therefore, the
Company’ s estimates of gross and net losses arising from a 250-year hurricane or earthquake event may not be comparable to estimates
provided by other companies. Furthermore, the Company’ s estimates are subject to significant uncertainty and could vary materially
from the actual losses that would arise from these events and the loss estimates provided by other companies. The Company also
manages natural catastrophe risk for group life, group disability, and individual life insurance, which in combination with property and
workers compensation loss estimates, are subject to separate enterprise risk management net aggregate loss limits as a percent of
enterprise surplus.
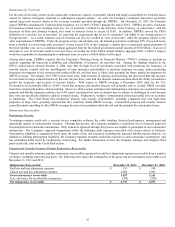
Terrorism Risk
The Company defines terrorism risk as the risk of losses from terrorist attacks, including losses caused by single-site and multi-site
conventional attacks, as well as the potential for attacks using nuclear, biological, chemical or radiological weapons (“NBCR”). The
Company monitors aggregations of terrorism risk exposure around key landmarks primarily in major metropolitan areas that span the
Company’ s insurance portfolio. Enterprise limits for terrorism apply to aggregations of risk across property-casualty, group benefits,
life insurance and specific asset portfolios and are defined based on a deterministic, single-site conventional terrorism attack scenario.
The Company manages its potential estimated loss from a terrorism loss scenario to less than $1.3 billion. In addition, the Company
monitors exposures monthly and employs both internally developed and vendor-licensed loss modeling tools as part of its risk
management discipline.
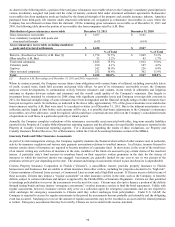
Pandemic Risk
Pandemic risk is the exposure to loss arising from widespread influenza or other pathogens or bacterial infections that create an
aggregation of loss across the Company’ s insurance or asset portfolios. Consistent with industry practice, the Company assesses
exposure to pandemics by analyzing the potential impact from a variety of pandemic scenarios based on conditions consistent with
historical outbreaks of flu-like viruses such as the “Severe” 1918 Spanish Flu, the Asian flu of 1957, the Hong Kong flu of 1968, and
the 2009 outbreak of the swine flu. For pandemic risk, the Company generally limits its estimated pre-tax loss from a single 250 year
event to less than 12.5% of the statutory surplus for the enterprise. In evaluating these scenarios, the Company assesses the impact on
group and individual life policies, short-term and long term disability, annuities, COLI, property & casualty claims, and losses in the
investment portfolio associated with market declines in the event of a widespread pandemic.