The Hartford 2011 Annual Report Download - page 142
Download and view the complete annual report
Please find page 142 of the 2011 The Hartford annual report below. You can navigate through the pages in the report by either clicking on the pages listed below, or by using the keyword search tool below to find specific information within the annual report.-
 1
1 -
2
-
3
-
4
-
5
-
6
-
7
-
8
-
9
-
10
-
11
-
12
-
13
-
14
-
15
-
16
-
17
-
18
-
19
-
20
-
21
-
22
-
23
-
24
-
25
-
26
-
27
-
28
-
29
-
30
-
31
-
32
-
33
-
34
-
35
-
36
-
37
-
38
-
39
-
40
-
41
-
42
-
43
-
44
-
45
-
46
-
47
-
48
-
49
-
50
-
51
-
52
-
53
-
54
-
55
-
56
-
57
-
58
-
59
-
60
-
61
-
62
-
63
-
64
-
65
-
66
-
67
-
68
-
69
-
70
-
71
-
72
-
73
-
74
-
75
-
76
-
77
-
78
-
79
-
80
-
81
-
82
-
83
-
84
-
85
-
86
-
87
-
88
-
89
-
90
-
91
-
92
-
93
-
94
-
95
-
96
-
97
-
98
-
99
-
100
-
101
-
102
-
103
-
104
-
105
-
106
-
107
-
108
-
109
-
110
-
111
-
112
-
113
-
114
-
115
-
116
-
117
-
118
-
119
-
120
-
121
-
122
-
123
-
124
-
125
-
126
-
127
-
128
-
129
-
130
-
131
-
 132
132 -
 133
133 -
 134
134 -
 135
135 -
 136
136 -
 137
137 -
 138
138 -
 139
139 -
 140
140 -
 141
141 -
 142
142 -
 143
143 -
 144
144 -
 145
145 -
 146
146 -
 147
147 -
 148
148 -
 149
149 -
 150
150 -
 151
151 -
 152
152 -
153
-
154
-
155
-
156
-
157
-
158
-
159
-
160
-
161
-
162
-
163
-
164
-
165
-
166
-
167
-
168
-
169
-
170
-
171
-
172
-
173
-
174
-
175
-
176
-
177
-
178
-
179
-
180
-
181
-
182
-
183
-
184
-
185
-
186
-
187
-
188
-
189
-
190
-
191
-
192
-
193
-
194
-
195
-
196
-
197
-
198
-
199
-
200
-
201
-
202
-
203
-
204
-
205
-
206
-
207
-
208
-
209
-
210
-
211
-
212
-
213
-
214
-
215
-
216
-
217
-
218
-
219
-
220
-
221
-
222
-
223
-
224
-
225
-
226
-
227
-
228
-
229
-
230
-
231
-
232
-
233
-
234
-
235
-
236
-
237
-
238
-
239
-
240
-
241
-
242
-
243
-
244
-
245
-
246
-
247
-
248
 |
 |

F-7
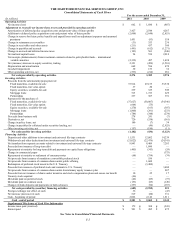
THE HARTFORD FINANCIAL SERVICES GROUP, INC.
Consolidated Statements of Cash Flows
For the years ended December 31,
(In millions)
2011
2010
2009
Operating Activities
Net income (loss)
$
662
$
1,680
$
(887)
Adjustments to reconcile net income (loss) to net cash provided by operating activities
Amortization of deferred policy acquisition costs and present value of future profits
3,427
2,544
4,267
Additions to deferred policy acquisition costs and present value of future profits (2,608) (2,648) (2,853)
Change in reserve for future policy benefits and unpaid losses and loss adjustment expenses and unearned
premiums 1,451 (93) 558
Change in reinsurance recoverables
(31)
353
236
Change in receivables and other assets
(211)
437
380
Change in payables and accruals
(491)
(612)
(1,271)
Change in accrued and deferred income taxes
(103)
561
(246)
Net realized capital losses
24
554
2,010
Net receipts (disbursements) from investment contracts related to policyholder funds – international
variable annuities
(2,332)
497
1,498
Net (increase) decrease in equity securities, trading
2,321
(499)
(1,501)
Depreciation and amortization
668
596
470
Goodwill impairment
30
153
32
Other operating activities, net
(533)
(214)
281
Net cash provided by operating activities
2,274
3,309
2,974
Investing Activities
Proceeds from the sale/maturity/prepayment of:
Fixed maturities, available-for-sale
37,914
49,155
53,538
Fixed maturities, fair value option
37
20
—
Equity securities, available-for-sale
239
325
949
Mortgage loans
515
1,723
629
Partnerships
237
367
391
Payments for the purchase of:
Fixed maturities, available-for-sale
(37,627)
(50,807)
(54,346)
Fixed maturities, fair value option
(664)
(75)
—
Equity securities, available-for-sale
(270)
(163)
(307)
Mortgage loans
(1,800)
(291)
(233)
Partnerships (784) (348) (274)
Proceeds from business sold
278
241
(7)
Derivatives, net
720
(338)
(561)
Change in policy loans, net
180
(7)
34
Change in payables for collateral under securities lending, net
—
(46)
(2,925)
Other investing activities, net
(157)
(190)
(11)
Net cash used for investing activities
(1,182)
(434)
(3,123)
Financing Activities
Deposits and other additions to investment and universal life-type contracts
11,531
12,602
14,239
Withdrawals and other deductions from investment and universal life-type contracts
(21,022)
(22,476)
(24,341)
Net transfers from separate accounts related to investment and universal life-type contracts 9,843 8,409 7,203
Proceeds from issuance of long-term debt — 1,090 —
Repayments at maturity for long-term debt and payments on capital lease obligations
(405)
(343)
(24)
Change in commercial paper
—
—
(375)
Repayments at maturity or settlement of consumer notes
(68)
(754)
(74)
Net proceeds from issuance of mandatory convertible preferred stock
—
556
—
Net proceeds from issuance of common shares under public offering
—
1,600
—
Redemption of preferred stock issued to the U.S. Treasury
—
(3,400)
—
Proceeds from issuance of preferred stock and warrants to U.S. Treasury
—
—
3,400
Net proceeds from issuance of common shares under discretionary equity issuance plan
—
—
887
Proceeds from net issuance of shares under incentive and stock compensation plans and excess tax benefit
10
25
17
Treasury stock acquired
(46)
—
—
Dividends paid on preferred stock
(42)
(85)
(73)
Dividends paid on common stock
(153)
(85)
(149)
Changes in bank deposits and payments on bank advances
(257)
(94)
(187)
Net cash provided by (used for) financing activities
(609)
(2,955)
523
Foreign exchange rate effect on cash
36
—
(43)
Net increase (decrease) in cash
519
(80)
331
Cash - beginning of period
2,062
2,142
1,811
Cash - end of period
$
2,581
$
2,062
$
2,142
Supplemental Disclosure of Cash Flow Information
Income taxes paid (received)
$
179
$
308
$
(243)
Interest paid
$
501
$
485
$
475
See Notes to Consolidated Financial Statements.