The Hartford 2011 Annual Report Download - page 150
Download and view the complete annual report
Please find page 150 of the 2011 The Hartford annual report below. You can navigate through the pages in the report by either clicking on the pages listed below, or by using the keyword search tool below to find specific information within the annual report.-
 1
1 -
2
-
3
-
4
-
5
-
6
-
7
-
8
-
9
-
10
-
11
-
12
-
13
-
14
-
15
-
16
-
17
-
18
-
19
-
20
-
21
-
22
-
23
-
24
-
25
-
26
-
27
-
28
-
29
-
30
-
31
-
32
-
33
-
34
-
35
-
36
-
37
-
38
-
39
-
40
-
41
-
42
-
43
-
44
-
45
-
46
-
47
-
48
-
49
-
50
-
51
-
52
-
53
-
54
-
55
-
56
-
57
-
58
-
59
-
60
-
61
-
62
-
63
-
64
-
65
-
66
-
67
-
68
-
69
-
70
-
71
-
72
-
73
-
74
-
75
-
76
-
77
-
78
-
79
-
80
-
81
-
82
-
83
-
84
-
85
-
86
-
87
-
88
-
89
-
90
-
91
-
92
-
93
-
94
-
95
-
96
-
97
-
98
-
99
-
100
-
101
-
102
-
103
-
104
-
105
-
106
-
107
-
108
-
109
-
110
-
111
-
112
-
113
-
114
-
115
-
116
-
117
-
118
-
119
-
120
-
121
-
122
-
123
-
124
-
125
-
126
-
127
-
128
-
129
-
130
-
131
-
132
-
133
-
134
-
135
-
136
-
137
-
138
-
139
-
 140
140 -
 141
141 -
 142
142 -
 143
143 -
 144
144 -
 145
145 -
 146
146 -
 147
147 -
 148
148 -
 149
149 -
 150
150 -
 151
151 -
 152
152 -
 153
153 -
 154
154 -
 155
155 -
 156
156 -
 157
157 -
 158
158 -
 159
159 -
 160
160 -
161
-
162
-
163
-
164
-
165
-
166
-
167
-
168
-
169
-
170
-
171
-
172
-
173
-
174
-
175
-
176
-
177
-
178
-
179
-
180
-
181
-
182
-
183
-
184
-
185
-
186
-
187
-
188
-
189
-
190
-
191
-
192
-
193
-
194
-
195
-
196
-
197
-
198
-
199
-
200
-
201
-
202
-
203
-
204
-
205
-
206
-
207
-
208
-
209
-
210
-
211
-
212
-
213
-
214
-
215
-
216
-
217
-
218
-
219
-
220
-
221
-
222
-
223
-
224
-
225
-
226
-
227
-
228
-
229
-
230
-
231
-
232
-
233
-
234
-
235
-
236
-
237
-
238
-
239
-
240
-
241
-
242
-
243
-
244
-
245
-
246
-
247
-
248
 |
 |

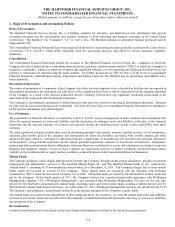
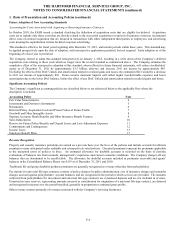
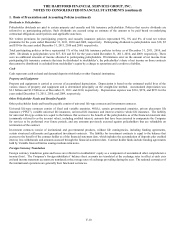
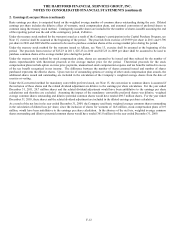
THE HARTFORD FINANCIAL SERVICES GROUP, INC.
NOTES TO CONSOLIDATED FINANCIAL STATEMENTS (continued)
F-15
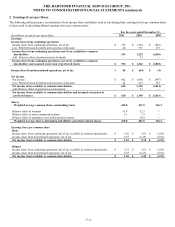
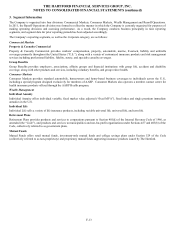
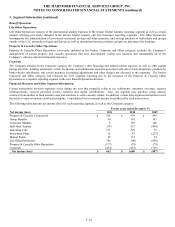
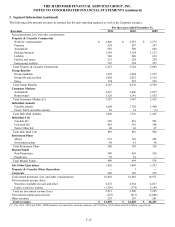
3. Segment Information (continued)
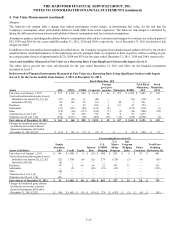
The following table presents revenues by product line for each reporting segment, as well as the Corporate category.
For the years ended December 31,
Revenues
2011
2010
2009
Earned premiums, fees, and other considerations
Property & Casualty Commercial
Workers’ compensation
$
2,809
$
2,387
$
2,275
Property
528
547
597
Automobile
583
598
646
Package business
1,145
1,124
1,123
Liability
540
540
619
Fidelity and surety
215
224
250
Professional liability
307
324
393
Total Property & Casualty Commercial
6,127
5,744
5,903
Group Benefits
Group disability
1,929
2,004
1,975
Group life and accident
2,024
2,052
2,126
Other
194
222
249
Total Group Benefits
4,147
4,278
4,350
Consumer Markets
Automobile
2,619
2,806
2,857
Homeowners
1,128
1,141
1,102
Total Consumer Markets [1]
3,747
3,947
3,959
Individual Annuity
Variable annuity
1,604
1,702
1,468
Fixed / MVA and other annuity
56
14
(3)
Total Individual Annuity
1,660
1,716
1,465
Individual Life
Variable life
396
416
503
Universal life
455
391
390
Term / Other life
48
49
47
Total Individual Life
899
856
940
Retirement Plans
401(k)
332
318
286
Government plans
48
41
38
Total Retirement Plans
380
359
324
Mutual Funds
Non-Proprietary
590
603
518
Proprietary
59
61
—
Total Mutual Funds
649
664
518
Life Other Operations
1,020
1,049
1,293
Property & Casualty Other Operations
—
1
—
Corporate
209
189
219
Total earned premiums, fees, and other considerations
18,838
18,803
18,971
Net investment income (loss):
Securities available-for-sale and other
4,272
4,364
4,017
Equity securities, trading
(1,359)
(774)
3,188
Total net investment income (loss)
2,913
3,590
7,205
Net realized capital gains (losses)
(145)
(611)
(2,004)
Other revenues
253
267
261
Total revenues
$
21,859
$
22,049
$
24,433
[1] For 2011, 2010 and 2009, AARP members accounted for earned premiums of $2.8 billion, $2.9 billion and $2.8 billion, respectively.