The Hartford 2011 Annual Report Download - page 64
Download and view the complete annual report
Please find page 64 of the 2011 The Hartford annual report below. You can navigate through the pages in the report by either clicking on the pages listed below, or by using the keyword search tool below to find specific information within the annual report.-
 1
1 -
2
-
3
-
4
-
5
-
6
-
7
-
8
-
9
-
10
-
11
-
12
-
13
-
14
-
15
-
16
-
17
-
18
-
19
-
20
-
21
-
22
-
23
-
24
-
25
-
26
-
27
-
28
-
29
-
30
-
31
-
32
-
33
-
34
-
35
-
36
-
37
-
38
-
39
-
40
-
41
-
42
-
43
-
44
-
45
-
46
-
47
-
48
-
49
-
50
-
51
-
52
-
53
-
 54
54 -
 55
55 -
 56
56 -
 57
57 -
 58
58 -
 59
59 -
 60
60 -
 61
61 -
 62
62 -
 63
63 -
 64
64 -
 65
65 -
 66
66 -
 67
67 -
 68
68 -
 69
69 -
 70
70 -
 71
71 -
 72
72 -
 73
73 -
 74
74 -
75
-
76
-
77
-
78
-
79
-
80
-
81
-
82
-
83
-
84
-
85
-
86
-
87
-
88
-
89
-
90
-
91
-
92
-
93
-
94
-
95
-
96
-
97
-
98
-
99
-
100
-
101
-
102
-
103
-
104
-
105
-
106
-
107
-
108
-
109
-
110
-
111
-
112
-
113
-
114
-
115
-
116
-
117
-
118
-
119
-
120
-
121
-
122
-
123
-
124
-
125
-
126
-
127
-
128
-
129
-
130
-
131
-
132
-
133
-
134
-
135
-
136
-
137
-
138
-
139
-
140
-
141
-
142
-
143
-
144
-
145
-
146
-
147
-
148
-
149
-
150
-
151
-
152
-
153
-
154
-
155
-
156
-
157
-
158
-
159
-
160
-
161
-
162
-
163
-
164
-
165
-
166
-
167
-
168
-
169
-
170
-
171
-
172
-
173
-
174
-
175
-
176
-
177
-
178
-
179
-
180
-
181
-
182
-
183
-
184
-
185
-
186
-
187
-
188
-
189
-
190
-
191
-
192
-
193
-
194
-
195
-
196
-
197
-
198
-
199
-
200
-
201
-
202
-
203
-
204
-
205
-
206
-
207
-
208
-
209
-
210
-
211
-
212
-
213
-
214
-
215
-
216
-
217
-
218
-
219
-
220
-
221
-
222
-
223
-
224
-
225
-
226
-
227
-
228
-
229
-
230
-
231
-
232
-
233
-
234
-
235
-
236
-
237
-
238
-
239
-
240
-
241
-
242
-
243
-
244
-
245
-
246
-
247
-
248
 |
 |

64
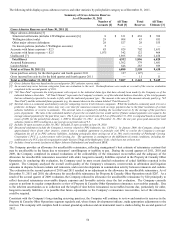
THE HARTFORD’S OPERATIONS OVERVIEW
The Hartford is a financial holding company for a group of subsidiaries that provide property and casualty and life insurance and
investment products to both individual and business customers in the United States and continues to administer business previously sold
in Japan and the U.K.
The Company conducts business in four divisions, Commercial Markets, Consumer Markets, Wealth Management and Runoff
Operations, each containing reporting segments. The Commercial Markets division consists of the reporting segments of Property &
Casualty Commercial and Group Benefits. The Consumer Markets division is also the reporting segment. The Wealth Management
division consists of the following reporting segments: Individual Annuity, Individual Life, Retirement Plans and Mutual Funds. The
Runoff division consists of Life Other Operations and Property & Casualty Other Operations. For additional discussion regarding The
Hartford’ s reporting segments, see Note 3 of the Notes to Consolidated Financial Statements.
The Company derives its revenues principally from: (a) premiums earned for insurance coverages provided to insureds; (b) fee income,
including asset management fees, on separate account and mutual fund assets and mortality and expense fees, as well as cost of
insurance charges; (c) net investment income; (d) fees earned for services provided to third parties; and (e) net realized capital gains and
losses. Premiums charged for insurance coverages are earned principally on a pro rata basis over the terms of the related policies in-
force. Asset management fees and mortality and expense fees are primarily generated from separate account assets, which are deposited
through the sale of variable annuity and variable universal life products and from mutual funds. Cost of insurance charges are assessed
on the net amount at risk for investment-oriented life insurance products. Service fees principally include revenues from member
contact center services provided through the AARP Health program.
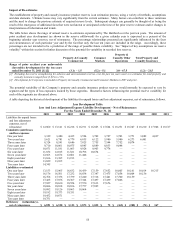
Profitability over time is greatly influenced by the Company's underwriting discipline, which seeks to manage exposure to loss through
favorable risk selection and diversification, its management of claims, its use of reinsurance, the size of its in force block, actual
mortality and morbidity experience, and its ability to manage its expense ratio which it accomplishes through economies of scale and its
management of acquisition costs and other underwriting expenses.
Pricing adequacy depends on a number of factors, including the ability to obtain regulatory approval for rate changes, proper evaluation
of underwriting risks, the ability to project future loss cost frequency and severity based on historical loss experience adjusted for known
trends, the Company’ s response to rate actions taken by competitors, and expectations about regulatory and legal developments and
expense levels. The Company seeks to price its insurance policies such that insurance premiums and future net investment income
earned on premiums received will cover underwriting expenses and the ultimate cost of paying claims reported on the policies and
provide for a profit margin. For many of its insurance products, the Company is required to obtain approval for its premium rates from
state insurance departments.
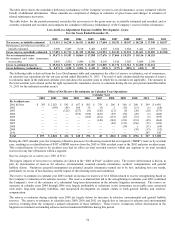
The financial results in the Company’ s variable annuity, mutual fund and, to a lesser extent, variable universal life businesses, depend
largely on the amount of the contract holder account value or assets under management on which it earns fees and the level of fees
charged. Changes in account value or assets under management are driven by two main factors: net flows, which measure the success of
the Company’ s asset gathering and retention efforts, and the market return of the funds, which is heavily influenced by the return
realized in the equity markets. Net flows are comprised of new sales and other deposits less surrenders, death benefits, policy charges
and annuitizations of investment type contracts, such as variable annuity contracts. In the mutual fund business, net flows are known as
net sales. Net sales are comprised of new sales less redemptions by mutual fund customers. The Company uses the average daily value
of the S&P 500 Index as an indicator for evaluating market returns of the underlying account portfolios in the United States. Relative
financial results of variable products are highly correlated to the growth in account values or assets under management since these
products generally earn fee income on a daily basis. Equity market movements could also result in benefits for or charges against
deferred acquisition costs.
The profitability of fixed annuities and other “spread-based” products depends largely on the Company’ s ability to earn target spreads
between earned investment rates on its general account assets and interest credited to policyholders. In addition, the size and persistency
of gross profits from these businesses is an important driver of earnings as it affects the rate of amortization of deferred policy
acquisition costs.
The investment return, or yield, on invested assets is an important element of the Company’ s earnings since insurance products are
priced with the assumption that premiums received can be invested for a period of time before benefits, loss and loss adjustment
expenses are paid. Due to the need to maintain sufficient liquidity to satisfy claim obligations, the majority of the Company’ s invested
assets have been held in available-for-sale securities, including, among other asset classes, corporate bonds, municipal bonds,
government debt, short-term debt, mortgage-backed securities and asset-backed securities.
The primary investment objective for the Company is to maximize economic value, consistent with acceptable risk parameters,
including the management of credit risk and interest rate sensitivity of invested assets, while generating sufficient after-tax income to
meet policyholder and corporate obligations. Investment strategies are developed based on a variety of factors including business needs,
regulatory requirements and tax considerations.
For a discussion on how The Hartford establishes property and casualty insurance product reserves, see “Property and Casualty
Insurance Product Reserves, Net of Reinsurance” in the Critical Accounting Estimates section of MD&A and for further information on
Unlocks, see “Estimated Gross Profits Used in the Valuation and Amortization of Assets and Liabilities Associated with Variable
Annuity and Other Universal Life-Type Contracts” also in the Critical Accounting Estimates section of MD&A.