The Hartford 2011 Annual Report Download - page 53
Download and view the complete annual report
Please find page 53 of the 2011 The Hartford annual report below. You can navigate through the pages in the report by either clicking on the pages listed below, or by using the keyword search tool below to find specific information within the annual report.-
 1
1 -
2
-
3
-
4
-
5
-
6
-
7
-
8
-
9
-
10
-
11
-
12
-
13
-
14
-
15
-
16
-
17
-
18
-
19
-
20
-
21
-
22
-
23
-
24
-
25
-
26
-
27
-
28
-
29
-
30
-
31
-
32
-
33
-
34
-
35
-
36
-
37
-
38
-
39
-
40
-
41
-
42
-
 43
43 -
 44
44 -
 45
45 -
 46
46 -
 47
47 -
 48
48 -
 49
49 -
 50
50 -
 51
51 -
 52
52 -
 53
53 -
 54
54 -
 55
55 -
 56
56 -
 57
57 -
 58
58 -
 59
59 -
 60
60 -
 61
61 -
 62
62 -
 63
63 -
64
-
65
-
66
-
67
-
68
-
69
-
70
-
71
-
72
-
73
-
74
-
75
-
76
-
77
-
78
-
79
-
80
-
81
-
82
-
83
-
84
-
85
-
86
-
87
-
88
-
89
-
90
-
91
-
92
-
93
-
94
-
95
-
96
-
97
-
98
-
99
-
100
-
101
-
102
-
103
-
104
-
105
-
106
-
107
-
108
-
109
-
110
-
111
-
112
-
113
-
114
-
115
-
116
-
117
-
118
-
119
-
120
-
121
-
122
-
123
-
124
-
125
-
126
-
127
-
128
-
129
-
130
-
131
-
132
-
133
-
134
-
135
-
136
-
137
-
138
-
139
-
140
-
141
-
142
-
143
-
144
-
145
-
146
-
147
-
148
-
149
-
150
-
151
-
152
-
153
-
154
-
155
-
156
-
157
-
158
-
159
-
160
-
161
-
162
-
163
-
164
-
165
-
166
-
167
-
168
-
169
-
170
-
171
-
172
-
173
-
174
-
175
-
176
-
177
-
178
-
179
-
180
-
181
-
182
-
183
-
184
-
185
-
186
-
187
-
188
-
189
-
190
-
191
-
192
-
193
-
194
-
195
-
196
-
197
-
198
-
199
-
200
-
201
-
202
-
203
-
204
-
205
-
206
-
207
-
208
-
209
-
210
-
211
-
212
-
213
-
214
-
215
-
216
-
217
-
218
-
219
-
220
-
221
-
222
-
223
-
224
-
225
-
226
-
227
-
228
-
229
-
230
-
231
-
232
-
233
-
234
-
235
-
236
-
237
-
238
-
239
-
240
-
241
-
242
-
243
-
244
-
245
-
246
-
247
-
248
 |
 |
53
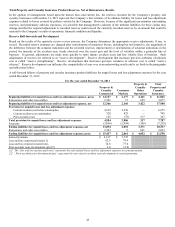
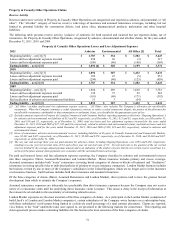
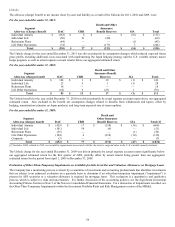
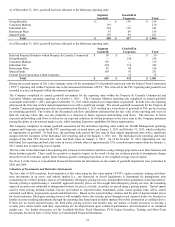
In reporting environmental results, the Company classifies its gross exposure into Direct, Assumed Reinsurance, and London Market.
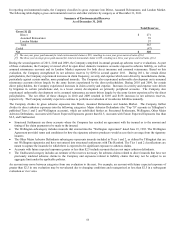
The following table displays gross environmental reserves and other statistics by category as of December 31, 2011.
Summary of Environmental Reserves
As of December 31, 2011
Total Reserves
Gross [1] [2]
Direct
$
271
Assumed Reinsurance
39
London Market
57
Total
367
Ceded
(47)
Net
$
320
[1] The one year gross paid amount for total environmental claims is $58, resulting in a one year gross survival ratio of 6.4.
[2] The three year average gross paid amount for total environmental claims is $58, resulting in a three year gross survival ratio of 6.4.
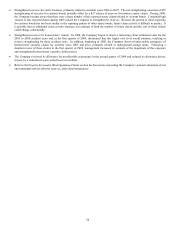
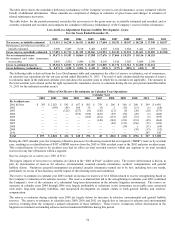
During the second quarters of 2011, 2010 and 2009, the Company completed its annual ground-up asbestos reserve evaluations. As part
of these evaluations, the Company reviewed all of its open direct domestic insurance accounts exposed to asbestos liability, as well as
assumed reinsurance accounts and its London Market exposures for both direct insurance and assumed reinsurance. Based on this
evaluation, the Company strengthened its net asbestos reserves by $290 in second quarter 2011. During 2011, for certain direct
policyholders, the Company experienced increases in claim frequency, severity and expense which were driven by mesothelioma claims,
particularly against certain smaller, more peripheral insureds. The Company also experienced unfavorable development on its assumed
reinsurance accounts driven largely by the same factors experienced by the direct policyholders. During 2010 and 2009, for certain
direct policyholders, the Company experienced increases in claim severity and expense. Increases in severity and expense were driven
by litigation in certain jurisdictions and, to a lesser extent, development on primarily peripheral accounts. The Company also
experienced unfavorable development on its assumed reinsurance accounts driven largely by the same factors experienced by the direct
policyholders. The net effect of these changes in 2010 and 2009 resulted in $169 and $138 increases in net asbestos reserves,
respectively. The Company currently expects to continue to perform an evaluation of its asbestos liabilities annually.
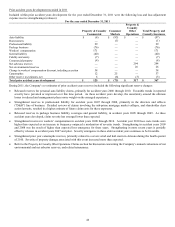
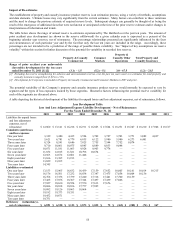
The Company divides its gross asbestos exposures into Direct, Assumed Reinsurance and London Market. The Company further
divides its direct asbestos exposures into the following categories: Major Asbestos Defendants (the “Top 70” accounts in Tillinghast’ s
published Tiers 1 and 2 and Wellington accounts), which are subdivided further as: Structured Settlements, Wellington, Other Major
Asbestos Defendants, Accounts with Future Expected Exposures greater than $2.5, Accounts with Future Expected Exposures less than
$2.5, and Unallocated.
• Structured Settlements are those accounts where the Company has reached an agreement with the insured as to the amount and
timing of the claim payments to be made to the insured.
• The Wellington subcategory includes insureds that entered into the “Wellington Agreement” dated June 19, 1985. The Wellington
Agreement provided terms and conditions for how the signatory asbestos producers would access their coverage from the signatory
insurers.
• The Other Major Asbestos Defendants subcategory represents insureds included in Tiers 1 and 2, as defined by Tillinghast that are
not Wellington signatories and have not entered into structured settlements with The Hartford. The Tier 1 and 2 classifications are
meant to capture the insureds for which there is expected to be significant exposure to asbestos claims.
• Accounts with future expected exposures greater or less than $2.5 include accounts that are not major asbestos defendants.
• The Unallocated category includes an estimate of the reserves necessary for asbestos claims related to direct insureds that have not
previously tendered asbestos claims to the Company and exposures related to liability claims that may not be subject to an
aggregate limit under the applicable policies.
An account may move between categories from one evaluation to the next. For example, an account with future expected exposure of
greater than $2.5 in one evaluation may be reevaluated due to changing conditions and recategorized as less than $2.5 in a subsequent
evaluation or vice versa.