The Hartford 2011 Annual Report Download - page 83
Download and view the complete annual report
Please find page 83 of the 2011 The Hartford annual report below. You can navigate through the pages in the report by either clicking on the pages listed below, or by using the keyword search tool below to find specific information within the annual report.-
 1
1 -
2
-
3
-
4
-
5
-
6
-
7
-
8
-
9
-
10
-
11
-
12
-
13
-
14
-
15
-
16
-
17
-
18
-
19
-
20
-
21
-
22
-
23
-
24
-
25
-
26
-
27
-
28
-
29
-
30
-
31
-
32
-
33
-
34
-
35
-
36
-
37
-
38
-
39
-
40
-
41
-
42
-
43
-
44
-
45
-
46
-
47
-
48
-
49
-
50
-
51
-
52
-
53
-
54
-
55
-
56
-
57
-
58
-
59
-
60
-
61
-
62
-
63
-
64
-
65
-
66
-
67
-
68
-
69
-
70
-
71
-
72
-
 73
73 -
 74
74 -
 75
75 -
 76
76 -
 77
77 -
 78
78 -
 79
79 -
 80
80 -
 81
81 -
 82
82 -
 83
83 -
 84
84 -
 85
85 -
 86
86 -
 87
87 -
 88
88 -
 89
89 -
 90
90 -
 91
91 -
 92
92 -
 93
93 -
94
-
95
-
96
-
97
-
98
-
99
-
100
-
101
-
102
-
103
-
104
-
105
-
106
-
107
-
108
-
109
-
110
-
111
-
112
-
113
-
114
-
115
-
116
-
117
-
118
-
119
-
120
-
121
-
122
-
123
-
124
-
125
-
126
-
127
-
128
-
129
-
130
-
131
-
132
-
133
-
134
-
135
-
136
-
137
-
138
-
139
-
140
-
141
-
142
-
143
-
144
-
145
-
146
-
147
-
148
-
149
-
150
-
151
-
152
-
153
-
154
-
155
-
156
-
157
-
158
-
159
-
160
-
161
-
162
-
163
-
164
-
165
-
166
-
167
-
168
-
169
-
170
-
171
-
172
-
173
-
174
-
175
-
176
-
177
-
178
-
179
-
180
-
181
-
182
-
183
-
184
-
185
-
186
-
187
-
188
-
189
-
190
-
191
-
192
-
193
-
194
-
195
-
196
-
197
-
198
-
199
-
200
-
201
-
202
-
203
-
204
-
205
-
206
-
207
-
208
-
209
-
210
-
211
-
212
-
213
-
214
-
215
-
216
-
217
-
218
-
219
-
220
-
221
-
222
-
223
-
224
-
225
-
226
-
227
-
228
-
229
-
230
-
231
-
232
-
233
-
234
-
235
-
236
-
237
-
238
-
239
-
240
-
241
-
242
-
243
-
244
-
245
-
246
-
247
-
248
 |
 |

83
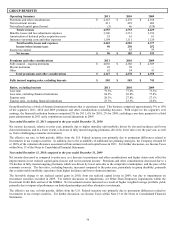
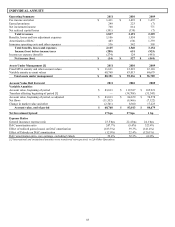
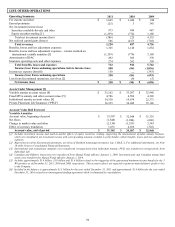
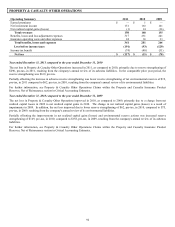
INDIVIDUAL ANNUITY
Operating Summary
2011
2010
2009
Fee income and other
$
1,411
$
1,493
$
1,472
Earned premiums
249
223
(7)
Net investment income
768
814
771
Net realized capital losses
(591)
(339)
(7)
Total revenues
1,837
2,191
2,229
Benefits, losses and loss adjustment expenses
1,106
1,054
1,310
Amortization of DAC
483
(56)
1,339
Insurance operating costs and other expenses
536
542
505
Total benefits, losses and expenses
2,125
1,540
3,154
Income (loss) before income taxes
(288)
651
(925)
Income tax expense (benefit)
(274)
124
(481)
Net income (loss)
$
(14)
$
527
$
(444)
Assets Under Management [1]
2011
2010
2009
Fixed MVA annuity and other account values
$
11,631
12,223
12,110
Variable annuity account values
68,760
83,013
84,679
Total assets under management
$
80,391
$
95,236
$
96,789
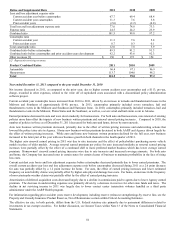
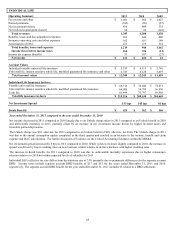
Account Value Roll Forward
2011
2010
2009
Variable Annuities
Account value, beginning of period
$
83,013
$
119,387
$
105,921
Transfers affecting beginning of period [1]
—
(34,708)
(31,343)
Account value, beginning of period, as adjusted
$
83,013
$
84,679
$
74,578
Net flows
(11,552)
(9,966)
(7,122)
Change in market value and other
(2,701)
8,300
17,223
Account value, end of period
$
68,760
$
83,013
$
84,679
Net Investment Spread
17 bps
27 bps
1 bp
Expense Ratios
General insurance expense ratio
23.5 bps
22.4 bps
24.1 bps
DAC amortization ratio
247.7%
(9.4%)
323.4%
Effect of realized gains (losses) on DAC amortization
(183.3%)
39.3%
(141.4%)
Effect of Unlocks on DAC amortization
(12.0%)
22.4%
(120.1%)
DAC amortization ratio, core earnings, excluding Unlock
52.4%
52.3%
62.0%
[1] International and institutional annuities were transferred retrospectively to Life Other Operations.