The Hartford 2011 Annual Report Download - page 87
Download and view the complete annual report
Please find page 87 of the 2011 The Hartford annual report below. You can navigate through the pages in the report by either clicking on the pages listed below, or by using the keyword search tool below to find specific information within the annual report.-
 1
1 -
2
-
3
-
4
-
5
-
6
-
7
-
8
-
9
-
10
-
11
-
12
-
13
-
14
-
15
-
16
-
17
-
18
-
19
-
20
-
21
-
22
-
23
-
24
-
25
-
26
-
27
-
28
-
29
-
30
-
31
-
32
-
33
-
34
-
35
-
36
-
37
-
38
-
39
-
40
-
41
-
42
-
43
-
44
-
45
-
46
-
47
-
48
-
49
-
50
-
51
-
52
-
53
-
54
-
55
-
56
-
57
-
58
-
59
-
60
-
61
-
62
-
63
-
64
-
65
-
66
-
67
-
68
-
69
-
70
-
71
-
72
-
73
-
74
-
75
-
76
-
 77
77 -
 78
78 -
 79
79 -
 80
80 -
 81
81 -
 82
82 -
 83
83 -
 84
84 -
 85
85 -
 86
86 -
 87
87 -
 88
88 -
 89
89 -
 90
90 -
 91
91 -
 92
92 -
 93
93 -
 94
94 -
 95
95 -
 96
96 -
 97
97 -
98
-
99
-
100
-
101
-
102
-
103
-
104
-
105
-
106
-
107
-
108
-
109
-
110
-
111
-
112
-
113
-
114
-
115
-
116
-
117
-
118
-
119
-
120
-
121
-
122
-
123
-
124
-
125
-
126
-
127
-
128
-
129
-
130
-
131
-
132
-
133
-
134
-
135
-
136
-
137
-
138
-
139
-
140
-
141
-
142
-
143
-
144
-
145
-
146
-
147
-
148
-
149
-
150
-
151
-
152
-
153
-
154
-
155
-
156
-
157
-
158
-
159
-
160
-
161
-
162
-
163
-
164
-
165
-
166
-
167
-
168
-
169
-
170
-
171
-
172
-
173
-
174
-
175
-
176
-
177
-
178
-
179
-
180
-
181
-
182
-
183
-
184
-
185
-
186
-
187
-
188
-
189
-
190
-
191
-
192
-
193
-
194
-
195
-
196
-
197
-
198
-
199
-
200
-
201
-
202
-
203
-
204
-
205
-
206
-
207
-
208
-
209
-
210
-
211
-
212
-
213
-
214
-
215
-
216
-
217
-
218
-
219
-
220
-
221
-
222
-
223
-
224
-
225
-
226
-
227
-
228
-
229
-
230
-
231
-
232
-
233
-
234
-
235
-
236
-
237
-
238
-
239
-
240
-
241
-
242
-
243
-
244
-
245
-
246
-
247
-
248
 |
 |

87
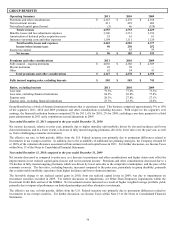
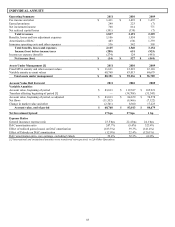
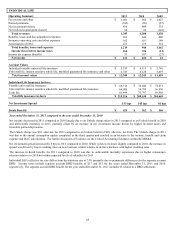
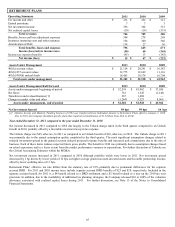
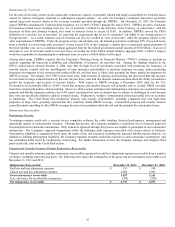
RETIREMENT PLANS
Operating Summary
2011
2010
2009
Fee income and other
$
373
$
352
$
321
Earned premiums
7
7
3
Net investment income
396
364
315
Net realized capital losses
(10)
(18)
(333)
Total revenues
766
705
306
Benefits, losses and loss adjustment expenses
308
278
269
Insurance operating costs and other expenses
354
340
346
Amortization of DAC
134
27
56
Total benefits, losses and expenses
796
645
671
Income (loss) before income taxes
(30)
60
(365)
Income tax expense (benefit)
(45)
13
(143)
Net income (loss)
$
15
$
47
$
(222)
Assets Under Management
2011
2010
2009
401(k) account values
$
21,124
$
20,291
$
16,142
403(b)/457 account values
12,775
12,649
11,116
401(k)/403(b) mutual funds
18,403
19,578
16,704
Total assets under management
$
52,302
$
52,518
$
43,962
Assets Under Management Roll Forward
2011
2010
2009
Assets under management, beginning of period
$
52,518
$
43,962
$
37,036
Net flows
761
1,545
(1,142)
Transfers in and reclassifications [1]
267
1,488
—
Change in market value and other
(1,244)
5,523
8,068
Assets under management, end of period
$
52,302
$
52,518
$
43,962
Net Investment Spread
98 bps
99 bps
66 bps
[1] Lifetime Income and Maturity Funding business of $194 was transferred from Individual Annuity to Retirement Plans effective January 1, 2010.
Also in 2010, the Company identified specific plans that required reclassification of $1.3 billion from AUA to AUM.
Year ended December 31, 2011 compared to the year ended December 31, 2010
Net income decreased in 2011 compared to 2010 due largely to the Unlock charge taken in the third quarter compared to an Unlock
benefit in 2010, partially offset by a favorable one-time true up in tax expense.
The Unlock charge was $45, after-tax, in 2011 as compared to an Unlock benefit of $18, after-tax, in 2010. The Unlock charge in 2011
was primarily due to the annual assumption update completed in the third quarter. The most significant assumption changes related to
reduced investment spread in the general account delayed projected expense benefits and increased trail commissions due to the mix of
business. Each of these items reduces expected future gross profits. The benefit in 2010 was primarily due to assumption changes based
on actual experience and to a lesser extent from the market performance variance to expectations. For further discussion of Unlocks see
the Critical Accounting Estimates within the MD&A.
Net investment income increased in 2011 compared to 2010 although portfolio yields were lower in 2011. Net investment spread
decreased by 1 bp driven by lower yields of 12 bps on higher average general account invested assets and favorable partnership income,
offset by lower crediting rates of 11 bps.
Retirement Plans’ effective tax rate differs from the statutory rate of 35% primarily due to permanent differences for the separate
account DRD. For 2011 and 2010 income taxes include separate account DRD benefits of $25 and $18, respectively. Included in the
separate account benefit for 2011 is a $4 benefit related to a DRD settlement and a $2 benefit related to a true up the 2010 tax year
provision. In addition, due to the availability of additional tax planning strategies, the Company released $10 or 100% of the valuation
allowance associated with realized capital losses during 2011. For further discussion, see Note 13 of the Notes to Consolidated
Financial Statements.