The Hartford 2011 Annual Report Download - page 172
Download and view the complete annual report
Please find page 172 of the 2011 The Hartford annual report below. You can navigate through the pages in the report by either clicking on the pages listed below, or by using the keyword search tool below to find specific information within the annual report.-
 1
1 -
2
-
3
-
4
-
5
-
6
-
7
-
8
-
9
-
10
-
11
-
12
-
13
-
14
-
15
-
16
-
17
-
18
-
19
-
20
-
21
-
22
-
23
-
24
-
25
-
26
-
27
-
28
-
29
-
30
-
31
-
32
-
33
-
34
-
35
-
36
-
37
-
38
-
39
-
40
-
41
-
42
-
43
-
44
-
45
-
46
-
47
-
48
-
49
-
50
-
51
-
52
-
53
-
54
-
55
-
56
-
57
-
58
-
59
-
60
-
61
-
62
-
63
-
64
-
65
-
66
-
67
-
68
-
69
-
70
-
71
-
72
-
73
-
74
-
75
-
76
-
77
-
78
-
79
-
80
-
81
-
82
-
83
-
84
-
85
-
86
-
87
-
88
-
89
-
90
-
91
-
92
-
93
-
94
-
95
-
96
-
97
-
98
-
99
-
100
-
101
-
102
-
103
-
104
-
105
-
106
-
107
-
108
-
109
-
110
-
111
-
112
-
113
-
114
-
115
-
116
-
117
-
118
-
119
-
120
-
121
-
122
-
123
-
124
-
125
-
126
-
127
-
128
-
129
-
130
-
131
-
132
-
133
-
134
-
135
-
136
-
137
-
138
-
139
-
140
-
141
-
142
-
143
-
144
-
145
-
146
-
147
-
148
-
149
-
150
-
151
-
152
-
153
-
154
-
155
-
156
-
157
-
158
-
159
-
160
-
161
-
 162
162 -
 163
163 -
 164
164 -
 165
165 -
 166
166 -
 167
167 -
 168
168 -
 169
169 -
 170
170 -
 171
171 -
 172
172 -
 173
173 -
 174
174 -
 175
175 -
 176
176 -
 177
177 -
 178
178 -
 179
179 -
 180
180 -
 181
181 -
 182
182 -
183
-
184
-
185
-
186
-
187
-
188
-
189
-
190
-
191
-
192
-
193
-
194
-
195
-
196
-
197
-
198
-
199
-
200
-
201
-
202
-
203
-
204
-
205
-
206
-
207
-
208
-
209
-
210
-
211
-
212
-
213
-
214
-
215
-
216
-
217
-
218
-
219
-
220
-
221
-
222
-
223
-
224
-
225
-
226
-
227
-
228
-
229
-
230
-
231
-
232
-
233
-
234
-
235
-
236
-
237
-
238
-
239
-
240
-
241
-
242
-
243
-
244
-
245
-
246
-
247
-
248
 |
 |

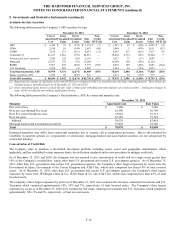
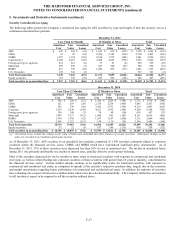
THE HARTFORD FINANCIAL SERVICES GROUP, INC.
NOTES TO CONSOLIDATED FINANCIAL STATEMENTS (continued)
F-37
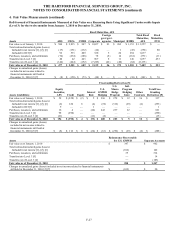
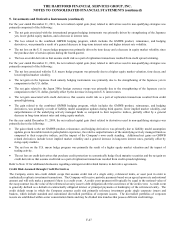
5. Investments and Derivative Instruments (continued)
Security Unrealized Loss Aging
The following tables present the Company’ s unrealized loss aging for AFS securities by type and length of time the security was in a
continuous unrealized loss position.
December 31, 2011
Less Than 12 Months
12 Months or More
Total
Amortized
Cost
Fair
Value
Unrealized
Losses
Amortized
Cost
Fair
Value
Unrealized
Losses
Amortized
Cost
Fair
Value
Unrealized
Losses
ABS
$
629
$
594
$
(35)
$
1,169
$
872
$
(297)
$
1,798
$
1,466
$
(332)
CDOs 81 59 (22) 2,709 2,383 (326) 2,790 2,442
(348)
CMBS
1,297
1,194
(103)
2,144
1,735
(409)
3,441
2,929
(512)
Corporate [1]
4,388
4,219
(169)
3,268
2,627
(570)
7,656
6,846
(739)
Foreign govt./govt. agencies
218
212
(6)
51
47
(4)
269
259
(10)
Municipal
299
294
(5)
627
560
(67)
926
854
(72)
RMBS
415
330
(85)
1,206
835
(371)
1,621
1,165
(456)
U.S. Treasuries 343 341 (2) — — — 343 341
(2)
Total fixed maturities
7,670
7,243
(427)
11,174
9,059
(2,044)
18,844
16,302
(2,471)
Equity securities
167
138
(29)
439
265
(174)
606
403
(203)
Total securities in an unrealized loss
$
7,837
$
7,381
$
(456)
$
11,613
$
9,324
$
(2,218)
$
19,450
$
16,705
$
(2,674)
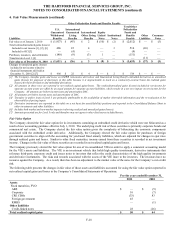
December 31, 2010
Less Than 12 Months 12 Months or More Total
Amortized
Cost
Fair
Value
Unrealized
Losses
Amortized
Cost
Fair
Value
Unrealized
Losses
Amortized
Cost
Fair
Value
Unrealized
Losses
ABS $
302 $ 290 $ (12) $ 1,410 $ 1,026 $ (384) $ 1,712 $ 1,316 $
(396)
CDOs
321
293
(28)
2,724
2,274
(450)
3,045
2,567
(478)
CMBS
556
530
(26)
3,962
3,373
(589)
4,518
3,903
(615)
Corporate
5,533
5,329
(199)
4,017
3,435
(548)
9,550
8,764
(747)
Foreign govt./govt. agencies
356
349
(7)
78
68
(10)
434
417
(17)
Municipal
7,485
7,173
(312)
1,046
863
(183)
8,531
8,036
(495)
RMBS
1,744
1,702
(42)
1,567
1,147
(420)
3,311
2,849
(462)
U.S. Treasuries
2,436
2,321
(115)
158
119
(39)
2,594
2,440
(154)
Total fixed maturities
18,733
17,987
(741)
14,962
12,305
(2,623)
33,695
30,292
(3,364)
Equity securities
53
52
(1)
637
506
(131)
690
558
(132)
Total securities in an unrealized loss
$
18,786
$
18,039
$
(742)
$
15,599
$
12,811
$
(2,754)
$
34,385
$
30,850
$
(3,496)
[1] Unrealized losses exclude the change in fair value of bifurcated embedded derivative features of certain securities. Subsequent changes in fair
value are recorded in net realized capital gains (losses).
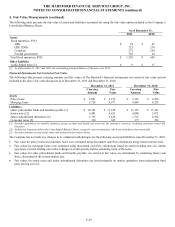
As of December 31, 2011, AFS securities in an unrealized loss position, comprised of 2,549 securities, primarily related to corporate
securities within the financial services sector, CMBS, and RMBS which have experienced significant price deterioration. As of
December 31, 2011, 75% of these securities were depressed less than 20% of cost or amortized cost. The decline in unrealized losses
during 2011 was primarily attributable to a decline in interest rates, partially offset by credit spread widening.
Most of the securities depressed for twelve months or more relate to structured securities with exposure to commercial and residential
real estate, as well as certain floating rate corporate securities or those securities with greater than 10 years to maturity, concentrated in
the financial services sector. Current market spreads continue to be significantly wider for structured securities with exposure to
commercial and residential real estate, as compared to spreads at the security’ s respective purchase date, largely due to the economic
and market uncertainties regarding future performance of commercial and residential real estate. In addition, the majority of securities
have a floating-rate coupon referenced to a market index where rates have declined substantially. The Company neither has an intention
to sell nor does it expect to be required to sell the securities outlined above.