The Hartford 2011 Annual Report Download - page 65
Download and view the complete annual report
Please find page 65 of the 2011 The Hartford annual report below. You can navigate through the pages in the report by either clicking on the pages listed below, or by using the keyword search tool below to find specific information within the annual report.-
 1
1 -
2
-
3
-
4
-
5
-
6
-
7
-
8
-
9
-
10
-
11
-
12
-
13
-
14
-
15
-
16
-
17
-
18
-
19
-
20
-
21
-
22
-
23
-
24
-
25
-
26
-
27
-
28
-
29
-
30
-
31
-
32
-
33
-
34
-
35
-
36
-
37
-
38
-
39
-
40
-
41
-
42
-
43
-
44
-
45
-
46
-
47
-
48
-
49
-
50
-
51
-
52
-
53
-
54
-
 55
55 -
 56
56 -
 57
57 -
 58
58 -
 59
59 -
 60
60 -
 61
61 -
 62
62 -
 63
63 -
 64
64 -
 65
65 -
 66
66 -
 67
67 -
 68
68 -
 69
69 -
 70
70 -
 71
71 -
 72
72 -
 73
73 -
 74
74 -
 75
75 -
76
-
77
-
78
-
79
-
80
-
81
-
82
-
83
-
84
-
85
-
86
-
87
-
88
-
89
-
90
-
91
-
92
-
93
-
94
-
95
-
96
-
97
-
98
-
99
-
100
-
101
-
102
-
103
-
104
-
105
-
106
-
107
-
108
-
109
-
110
-
111
-
112
-
113
-
114
-
115
-
116
-
117
-
118
-
119
-
120
-
121
-
122
-
123
-
124
-
125
-
126
-
127
-
128
-
129
-
130
-
131
-
132
-
133
-
134
-
135
-
136
-
137
-
138
-
139
-
140
-
141
-
142
-
143
-
144
-
145
-
146
-
147
-
148
-
149
-
150
-
151
-
152
-
153
-
154
-
155
-
156
-
157
-
158
-
159
-
160
-
161
-
162
-
163
-
164
-
165
-
166
-
167
-
168
-
169
-
170
-
171
-
172
-
173
-
174
-
175
-
176
-
177
-
178
-
179
-
180
-
181
-
182
-
183
-
184
-
185
-
186
-
187
-
188
-
189
-
190
-
191
-
192
-
193
-
194
-
195
-
196
-
197
-
198
-
199
-
200
-
201
-
202
-
203
-
204
-
205
-
206
-
207
-
208
-
209
-
210
-
211
-
212
-
213
-
214
-
215
-
216
-
217
-
218
-
219
-
220
-
221
-
222
-
223
-
224
-
225
-
226
-
227
-
228
-
229
-
230
-
231
-
232
-
233
-
234
-
235
-
236
-
237
-
238
-
239
-
240
-
241
-
242
-
243
-
244
-
245
-
246
-
247
-
248
 |
 |
65
Definitions of Non-GAAP and other measures and ratios
Account Value
Account value includes policyholders’ balances for investment contracts and reserves for future policy benefits for insurance contracts.
Account value is a measure used by the Company because a significant portion of the Company’ s fee income is based upon the level of
account value. These revenues increase or decrease with a rise or fall in the amount of account value whether caused by changes in the
market or through net flows.
After-tax Margin, Core Earnings excluding Unlock
After-tax margin, core earnings excluding Unlock, is a non-GAAP financial measure that the Company uses to evaluate, and believes is
an important measure of, certain of the segment’ s operating performance. After-tax margin is the most directly comparable U.S. GAAP
measure. The Hartford believes that the measure after-tax margin, core earnings excluding Unlock, provides investors with a valuable
measure of the performance of certain of the Company’ s on-going businesses because it reveals trends in those businesses that may be
obscured by the effect of realized gains (losses) and quarterly Unlocks. Unlocks occur when the Company determines based on actual
experience or other evidence, that estimates of future gross profits should be revised. As the Unlock is a reflection of the Company’ s
new best estimates of future gross profits, the result of the Unlock and its impact distort the trend of after-tax margin. After-tax margin,
excluding realized gains (losses) and Unlock, should not be considered as a substitute for After-tax margin and does not reflect the
overall profitability of our businesses. Therefore, the Company believes it is important for investors to evaluate both after-tax margin,
core earnings excluding Unlock, and after-tax margin when reviewing the Company’ s performance. After-tax margin, core earnings
excluding Unlock is calculated by dividing core earnings excluding Unlocks by total core revenues excluding Unlocks. A reconciliation
of After-tax margin to After-tax margin, core earnings excluding Unlock for the year ended December 31, 2011, 2010 and 2009 is set
forth in the After-tax Margin section within Key Performance Measures and Ratios. For additional information regarding the Unlock,
see Critical Accounting Estimates within the MD&A.
Assets Under Management
Assets under management (“AUM”) include account values and mutual fund assets. AUM is a measure used by the Company because a
significant portion of the Company’ s revenues are based upon asset values. These revenues increase or decrease with a rise or fall in the
amount of account value whether caused by changes in the market or through net flows.
Catastrophe ratio
The catastrophe ratio (a component of the loss and loss adjustment expense ratio) represents the ratio of catastrophe losses incurred in
the current calendar year (net of reinsurance) to earned premiums and includes catastrophe losses incurred for both the current and prior
accident years. A catastrophe is an event that causes $25 or more in industry insured property losses and affects a significant number of
property and casualty policyholders and insurers. The catastrophe ratio includes the effect of catastrophe losses, but does not include the
effect of reinstatement premiums.
Combined ratio
The combined ratio is the sum of the loss and loss adjustment expense ratio, the expense ratio and the policyholder dividend ratio. This
ratio is a relative measurement that describes the related cost of losses and expenses for every $100 of earned premiums. A combined
ratio below 100.0 demonstrates underwriting profit; a combined ratio above 100.0 demonstrates underwriting losses.
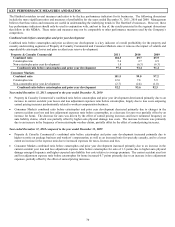
Combined ratio before catastrophes and prior accident year development
The combined ratio before catastrophes and prior accident year development, a non-GAAP measure, represents the combined ratio for
the current accident year, excluding the impact of catastrophes. Combined ratio is the most directly comparable U.S. GAAP measure.
The Company believes this ratio is an important measure of the trend in profitability since it removes the impact of volatile and
unpredictable catastrophe losses and prior accident year reserve development. A reconciliation of combined ratio to combined ratio
before prior accident year reserve development for the years ended December 31, 2011, 2010 and 2009 is set forth in the Combined ratio
before catastrophes and prior year development section within Key Performance Measures and Ratios.