The Hartford 2011 Annual Report Download - page 116
Download and view the complete annual report
Please find page 116 of the 2011 The Hartford annual report below. You can navigate through the pages in the report by either clicking on the pages listed below, or by using the keyword search tool below to find specific information within the annual report.-
 1
1 -
2
-
3
-
4
-
5
-
6
-
7
-
8
-
9
-
10
-
11
-
12
-
13
-
14
-
15
-
16
-
17
-
18
-
19
-
20
-
21
-
22
-
23
-
24
-
25
-
26
-
27
-
28
-
29
-
30
-
31
-
32
-
33
-
34
-
35
-
36
-
37
-
38
-
39
-
40
-
41
-
42
-
43
-
44
-
45
-
46
-
47
-
48
-
49
-
50
-
51
-
52
-
53
-
54
-
55
-
56
-
57
-
58
-
59
-
60
-
61
-
62
-
63
-
64
-
65
-
66
-
67
-
68
-
69
-
70
-
71
-
72
-
73
-
74
-
75
-
76
-
77
-
78
-
79
-
80
-
81
-
82
-
83
-
84
-
85
-
86
-
87
-
88
-
89
-
90
-
91
-
92
-
93
-
94
-
95
-
96
-
97
-
98
-
99
-
100
-
101
-
102
-
103
-
104
-
105
-
 106
106 -
 107
107 -
 108
108 -
 109
109 -
 110
110 -
 111
111 -
 112
112 -
 113
113 -
 114
114 -
 115
115 -
 116
116 -
 117
117 -
 118
118 -
 119
119 -
 120
120 -
 121
121 -
 122
122 -
 123
123 -
 124
124 -
 125
125 -
 126
126 -
127
-
128
-
129
-
130
-
131
-
132
-
133
-
134
-
135
-
136
-
137
-
138
-
139
-
140
-
141
-
142
-
143
-
144
-
145
-
146
-
147
-
148
-
149
-
150
-
151
-
152
-
153
-
154
-
155
-
156
-
157
-
158
-
159
-
160
-
161
-
162
-
163
-
164
-
165
-
166
-
167
-
168
-
169
-
170
-
171
-
172
-
173
-
174
-
175
-
176
-
177
-
178
-
179
-
180
-
181
-
182
-
183
-
184
-
185
-
186
-
187
-
188
-
189
-
190
-
191
-
192
-
193
-
194
-
195
-
196
-
197
-
198
-
199
-
200
-
201
-
202
-
203
-
204
-
205
-
206
-
207
-
208
-
209
-
210
-
211
-
212
-
213
-
214
-
215
-
216
-
217
-
218
-
219
-
220
-
221
-
222
-
223
-
224
-
225
-
226
-
227
-
228
-
229
-
230
-
231
-
232
-
233
-
234
-
235
-
236
-
237
-
238
-
239
-
240
-
241
-
242
-
243
-
244
-
245
-
246
-
247
-
248
 |
 |

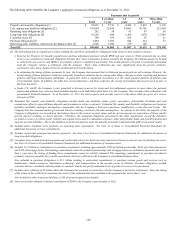
116
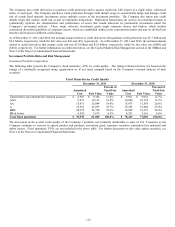
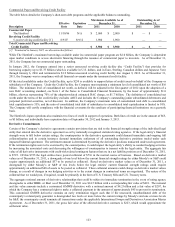
Financial Services
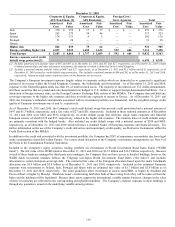
The Company’ s exposure to the financial services sector is predominantly through banking and insurance institutions. The following
table presents the Company’ s exposure to the financial services sector included in the Securities by Type table above.
December 31, 2011 December 31, 2010
Amortized
Cost
Fair Value
Net
Unrealized
Amortized
Cost
Fair Value
Net
Unrealized
AAA
$
240
$
245
$
5
$
302
$
309
$
7
AA
1,698
1,675
(23)
2,085
2,095
10
A
3,664
3,685
21
3,760
3,599
(161)
BBB
2,335
1,998
(337)
1,677
1,518
(159)
BB & below
305
270
(35)
290
253
(37)
Total
$
8,242
$
7,873
$
(369)
$
8,114
$
7,774
$
(340)
Domestic financial companies continued to stabilize throughout 2011 due to improved earnings performance, strengthening of asset
quality and capital retention. However, spread volatility remains high due to concerns around European sovereign risks and potential
contagion, regulatory pressures and a weaker U.S. macroeconomic environment. Financial institutions remain vulnerable to these
concerns, as well as ongoing stress in the real estate markets which could adversely impact the Company’ s net unrealized position.
Included in the table above as of December 31, 2011, is an amortized cost and fair value of $1.3 billion and $1.2 billion, respectively,
related to European investment exposure, of which only $20 and $19, respectively, relates to GIIPS. As of December 31, 2010,
amortized cost and fair value includes $1.8 billion and $1.7 billion, respectively, of European exposure, of which only $75 and $66,
respectively, relates to GIIPS.
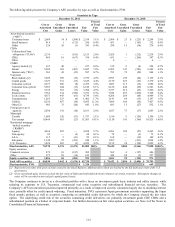
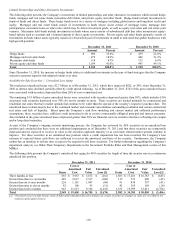
Commercial Real Estate
The commercial real estate market continued to show signs of improving fundamentals, such as increases in transaction activities, more
readily available financing and new issuances. While delinquencies still remain at historically high levels, they are expected to move
lower in 2012.
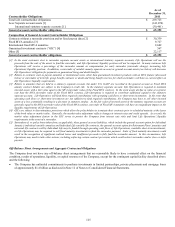
The following table presents the Company’ s exposure to commercial mortgage backed-securities (“CMBS”) bonds by current credit
quality and vintage year, included in the Securities by Type table above. Credit protection represents the current weighted average
percentage of the outstanding capital structure subordinated to the Company’ s investment holding that is available to absorb losses
before the security incurs the first dollar loss of principal and excludes any equity interest or property value in excess of outstanding
debt.
CMBS – Bonds [1]
December 31, 2011
AAA
AA
A
BBB
BB and Below
Total
Amortized
Cost
Fair
Value
Amortized
Cost
Fair
Value
Amortized
Cost
Fair
Value
Amortized
Cost
Fair
Value
Amortized
Cost
Fair
Value
Amortized
Cost
Fair
Value
2003 & Prior
$
408
$
415
$
148
$
144
$
83
$
81
$
16
$
13
$
33
$
30
$
688
$
683
2004
333
349
68
75
45
41
30
28
26
21
502
514
2005
520
556
101
96
178
151
177
138
71
57
1,047
998
2006
713
762
516
493
180
159
362
298
430
302
2,201
2,014
2007
245
267
296
275
123
97
166
130
195
149
1,025
918
2008 55 60 — — — — — — — — 55 60
2009
28
29
—
—
—
—
—
—
—
—
28
29
2010
29
31
—
—
—
—
—
—
—
—
29
31
2011
417
440
—
—
—
—
—
—
—
—
417
440
Total
$
2,748
$
2,909
$
1,129
$
1,083
$
609
$
529
$
751
$
607
$
755
$
559
$
5,992
$
5,687
Credit
protection
27.3%
22.7%
19.7%
13.8%
8.2%
21.6%