The Hartford 2011 Annual Report Download - page 32
Download and view the complete annual report
Please find page 32 of the 2011 The Hartford annual report below. You can navigate through the pages in the report by either clicking on the pages listed below, or by using the keyword search tool below to find specific information within the annual report.-
 1
1 -
2
-
3
-
4
-
5
-
6
-
7
-
8
-
9
-
10
-
11
-
12
-
13
-
14
-
15
-
16
-
17
-
18
-
19
-
20
-
21
-
 22
22 -
 23
23 -
 24
24 -
 25
25 -
 26
26 -
 27
27 -
 28
28 -
 29
29 -
 30
30 -
 31
31 -
 32
32 -
 33
33 -
 34
34 -
 35
35 -
 36
36 -
 37
37 -
 38
38 -
 39
39 -
 40
40 -
 41
41 -
 42
42 -
43
-
44
-
45
-
46
-
47
-
48
-
49
-
50
-
51
-
52
-
53
-
54
-
55
-
56
-
57
-
58
-
59
-
60
-
61
-
62
-
63
-
64
-
65
-
66
-
67
-
68
-
69
-
70
-
71
-
72
-
73
-
74
-
75
-
76
-
77
-
78
-
79
-
80
-
81
-
82
-
83
-
84
-
85
-
86
-
87
-
88
-
89
-
90
-
91
-
92
-
93
-
94
-
95
-
96
-
97
-
98
-
99
-
100
-
101
-
102
-
103
-
104
-
105
-
106
-
107
-
108
-
109
-
110
-
111
-
112
-
113
-
114
-
115
-
116
-
117
-
118
-
119
-
120
-
121
-
122
-
123
-
124
-
125
-
126
-
127
-
128
-
129
-
130
-
131
-
132
-
133
-
134
-
135
-
136
-
137
-
138
-
139
-
140
-
141
-
142
-
143
-
144
-
145
-
146
-
147
-
148
-
149
-
150
-
151
-
152
-
153
-
154
-
155
-
156
-
157
-
158
-
159
-
160
-
161
-
162
-
163
-
164
-
165
-
166
-
167
-
168
-
169
-
170
-
171
-
172
-
173
-
174
-
175
-
176
-
177
-
178
-
179
-
180
-
181
-
182
-
183
-
184
-
185
-
186
-
187
-
188
-
189
-
190
-
191
-
192
-
193
-
194
-
195
-
196
-
197
-
198
-
199
-
200
-
201
-
202
-
203
-
204
-
205
-
206
-
207
-
208
-
209
-
210
-
211
-
212
-
213
-
214
-
215
-
216
-
217
-
218
-
219
-
220
-
221
-
222
-
223
-
224
-
225
-
226
-
227
-
228
-
229
-
230
-
231
-
232
-
233
-
234
-
235
-
236
-
237
-
238
-
239
-
240
-
241
-
242
-
243
-
244
-
245
-
246
-
247
-
248
 |
 |

32
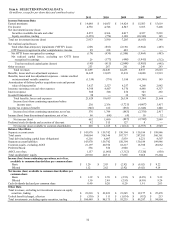
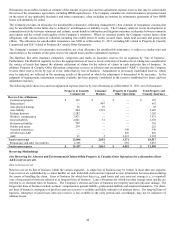
Item 6. SELECTED FINANCIAL DATA
(In millions, except for per share data and combined ratios)
2011
2010
2009
2008
2007
Income Statement Data
Earned premiums
$
14,088
$
14,055
$
14,424
$
15,503
$
15,619
Fee income
4,750
4,748
4,547
5,103
5,408
Net investment income (loss):
Securities available-for-sale and other
4,272
4,364
4,017
4,327
5,203
Equity securities, trading
(1,359)
(774)
3,188
(10,340)
145
Total net investment income (loss)
2,913
3,590
7,205
(6,013)
5,348
Net realized capital losses:
Total other-than-temporary impairment ("OTTI") losses
(263)
(852)
(2,191)
(3,964)
(483)
OTTI losses recognized in other comprehensive income
89
418
683
—
—
Net OTTI losses recognized in earnings
(174)
(434)
(1,508)
(3,964)
(483)
Net realized capital losses, excluding net OTTI losses
recognized in earnings
29
(177
)
(496
)
(1,941
)
(512)
Total net realized capital gains (losses)
(145)
(611
)
(2,004
)
(5,905
)
(995)
Other revenues
253
267
261
249
243
Total revenues
21,859
22,049
24,433
8,937
25,623
Benefits, losses and loss adjustment expenses
14,625
13,025
13,831
14,088
13,919
Benefits, losses and loss adjustment expenses – returns credited
on international variable annuities
(1,359)
(774)
3,188
(10,340)
145
Amortization of deferred policy acquisition costs and present
value of future profits
3,427
2,527
4,257
4,260
2,982
Insurance operating costs and other expenses
4,398
4,407
4,370
4,448
4,357
Interest expense
508
508
476
343
263
Goodwill impairment
30
—
32
745
—
Total benefits, losses and expenses
21,629
19,693
26,154
13,544
21,666
Income (loss) from continuing operations before
income taxes 230 2,356 (1,721) (4,607) 3,957
Income tax expense (benefit)
(346)
612
(838)
(1,848)
1,040
Income (loss) from continuing operations, net of tax
576
1,744
(883)
(2,759)
2,917
Income (loss) from discontinued operations, net of tax 86 (64
)
(4
)
10 32
Net income (loss)
662
1,680
(887
)
(2,749
)
2,949
Preferred stock dividends and accretion of discount
42
515
127
8
—
Net income (loss) available to common shareholders
$
620
$
1,165
$
(1,014)
$
(2,757)
$
2,949
Balance Sheet Data
Separate account assets
$
143,870
$
159,742
$
150,394
$
130,184
$
199,946
Total assets
304,064
318,346
307,717
287,583
360,361
Total debt (including capital lease obligations)
6,216
6,607
5,839
6,221
4,507
Separate account liabilities
143,870
159,742
150,394
130,184
199,946
Common equity, excluding AOCI
21,197
20,756
18,217
16,788
20,062
Preferred Stock
556
556
2,960
—
—
AOCI, net of tax
1,157
(1,001
)
(3,312
)
(7,520
)
(858)
Total stockholders’ equity
22,910
20,311
17,865
9,268
19,204
Income (loss) from continuing operations, net of tax,
available to common shareholders per common share
Basic
$
1.20
$
2.85
$
(2.92)
$
(9.02)
$
9.22
Diluted
1.12
2.62
(2.92)
(9.02)
9.14
Net income (loss) available to common shareholders per
common share
Basic
$
1.39
$
2.70
$
(2.93)
$
(8.99)
$
9.32
Diluted
1.30
2.49
(2.93)
(8.99)
9.24
Cash dividends declared per common share
0.40
0.20
0.20
1.91
2.03
Other Data
Total revenues, excluding net investment income on equity
securities, trading
$
23,218
$
22,823
$
21,245
$
19,277
$
25,478
Unlock benefit (charge), after-tax
$
(530)
$
111
$
(1,034)
$
(932)
$
213
Total investments, excluding equity securities, trading
$
104,449
$
98,175
$
93,235
$
89,287
$
94,904