The Hartford 2011 Annual Report Download - page 89
Download and view the complete annual report
Please find page 89 of the 2011 The Hartford annual report below. You can navigate through the pages in the report by either clicking on the pages listed below, or by using the keyword search tool below to find specific information within the annual report.-
 1
1 -
2
-
3
-
4
-
5
-
6
-
7
-
8
-
9
-
10
-
11
-
12
-
13
-
14
-
15
-
16
-
17
-
18
-
19
-
20
-
21
-
22
-
23
-
24
-
25
-
26
-
27
-
28
-
29
-
30
-
31
-
32
-
33
-
34
-
35
-
36
-
37
-
38
-
39
-
40
-
41
-
42
-
43
-
44
-
45
-
46
-
47
-
48
-
49
-
50
-
51
-
52
-
53
-
54
-
55
-
56
-
57
-
58
-
59
-
60
-
61
-
62
-
63
-
64
-
65
-
66
-
67
-
68
-
69
-
70
-
71
-
72
-
73
-
74
-
75
-
76
-
77
-
78
-
 79
79 -
 80
80 -
 81
81 -
 82
82 -
 83
83 -
 84
84 -
 85
85 -
 86
86 -
 87
87 -
 88
88 -
 89
89 -
 90
90 -
 91
91 -
 92
92 -
 93
93 -
 94
94 -
 95
95 -
 96
96 -
 97
97 -
 98
98 -
 99
99 -
100
-
101
-
102
-
103
-
104
-
105
-
106
-
107
-
108
-
109
-
110
-
111
-
112
-
113
-
114
-
115
-
116
-
117
-
118
-
119
-
120
-
121
-
122
-
123
-
124
-
125
-
126
-
127
-
128
-
129
-
130
-
131
-
132
-
133
-
134
-
135
-
136
-
137
-
138
-
139
-
140
-
141
-
142
-
143
-
144
-
145
-
146
-
147
-
148
-
149
-
150
-
151
-
152
-
153
-
154
-
155
-
156
-
157
-
158
-
159
-
160
-
161
-
162
-
163
-
164
-
165
-
166
-
167
-
168
-
169
-
170
-
171
-
172
-
173
-
174
-
175
-
176
-
177
-
178
-
179
-
180
-
181
-
182
-
183
-
184
-
185
-
186
-
187
-
188
-
189
-
190
-
191
-
192
-
193
-
194
-
195
-
196
-
197
-
198
-
199
-
200
-
201
-
202
-
203
-
204
-
205
-
206
-
207
-
208
-
209
-
210
-
211
-
212
-
213
-
214
-
215
-
216
-
217
-
218
-
219
-
220
-
221
-
222
-
223
-
224
-
225
-
226
-
227
-
228
-
229
-
230
-
231
-
232
-
233
-
234
-
235
-
236
-
237
-
238
-
239
-
240
-
241
-
242
-
243
-
244
-
245
-
246
-
247
-
248
 |
 |

89
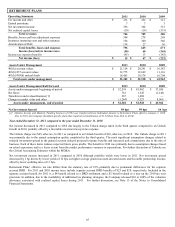
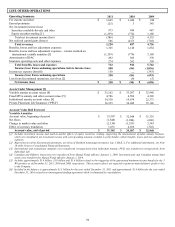
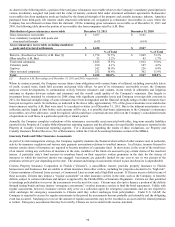
MUTUAL FUNDS
Operating Summary
2011
2010
2009
Fee income and other
$
649
$
664
$
518
Net investment loss
(3)
(8)
(21)
Net realized capital gains (loss)
1
—
—
Total revenues
647
656
497
Insurance operating costs and other expenses
448
458
395
Amortization of DAC
47
51
50
Total benefits, losses and expenses
495
509
445
Income from continuing operations, before income taxes
152
147
52
Income tax expense
54
52
18
Income from continuing operations
98
95
34
Income from discontinued operations, net of tax [1]
—
37
—
Net income
$
98
$
132
$
34
Assets Under Management
2011
2010
2009
Retail mutual fund assets
$
40,228
$
48,753
$
42,829
Investment Only mutual fund assets
6,983
6,659
—
529 College Savings Plan and Canadian mutual fund assets
1,557
1,472
1,202
Total non-proprietary and Canadian mutual fund assets
48,768
56,884
44,031
Proprietary mutual fund assets
36,770
43,602
—
Total mutual fund assets under management
$
85,538
$
100,486
$
44,031
Non-Proprietary and Canadian Mutual Fund AUM Roll Forward
2011
2010
2009
Non-Proprietary and Canadian Mutual Fund AUM, beginning of period
$
56,884
$
44,031
$
32,710
Transfers in (out) [2]
—
5,617
(826)
Net flows
(4,378)
2,750
2,115
Change in market value and other
(3,738)
4,486
10,032
Non-Proprietary and Canadian Mutual Fund AUM, end of period
$
48,768
$
56,884
$
44,031
Proprietary Mutual Fund AUM Roll Forward
2011
2010
2009
Proprietary Mutual Fund AUM, beginning of period
$
43,602
$
—
$
—
Transfers in [3]
—
43,890
—
Net flows
(5,797)
(5,334)
—
Change in market value
(1,035)
5,046
—
Proprietary Mutual Fund AUM, end of period
$
36,770
$
43,602
$
—
[1] Represents income from discontinued operations, net of tax of Hartford Investments Canada Corporation (“HICC”). For additional information,
see Note 20 of the Notes to Consolidated Financial Statements.
[2] Canadian and Offshore businesses were transferred to International Annuity within Life Other Operations effective January 1, 2009. Investment-
only and Canadian mutual fund assets were transferred from Life Other Operations effective January 1, 2010.
[3] Proprietary mutual fund assets under management are included in the Mutual Fund reporting segment effective January 1, 2010.
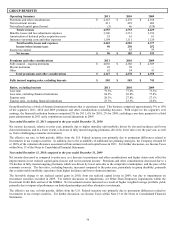
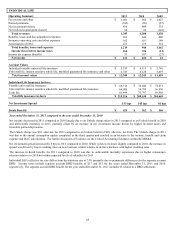
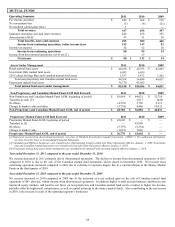
Year ended December 31, 2011 compared to the year ended December 31, 2010
Net income decreased in 2011 primarily due to discontinued operations. The decline in income from discontinued operations in 2011
compared to 2010 is due to the sale of the Canadian mutual fund operations, which closed in December 2010. Net income from
continuing operations increased compared to 2010 due to a decline in expenses largely due to a capital infusion to the Money Market
Funds in the third quarter of 2010.
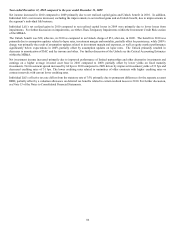
Year ended December 31, 2010 compared to the year ended December 31, 2009
Net income increased in 2010 compared to 2009 due to the inclusion of a net realized gain on the sale of Canadian mutual fund
operations of $41 after-tax, within income from discontinued operations. In addition higher overall account balances attributed to the
improved equity markets, and positive net flows on non-proprietary and Canadian mutual fund assets, resulted in higher fee income,
partially offset by higher trail commissions, as well as capital infusions to the money market funds. Also contributing to the net income
in 2010 is the increase in scale of the reporting segment’ s businesses.