The Hartford 2011 Annual Report Download - page 67
Download and view the complete annual report
Please find page 67 of the 2011 The Hartford annual report below. You can navigate through the pages in the report by either clicking on the pages listed below, or by using the keyword search tool below to find specific information within the annual report.-
 1
1 -
2
-
3
-
4
-
5
-
6
-
7
-
8
-
9
-
10
-
11
-
12
-
13
-
14
-
15
-
16
-
17
-
18
-
19
-
20
-
21
-
22
-
23
-
24
-
25
-
26
-
27
-
28
-
29
-
30
-
31
-
32
-
33
-
34
-
35
-
36
-
37
-
38
-
39
-
40
-
41
-
42
-
43
-
44
-
45
-
46
-
47
-
48
-
49
-
50
-
51
-
52
-
53
-
54
-
55
-
56
-
 57
57 -
 58
58 -
 59
59 -
 60
60 -
 61
61 -
 62
62 -
 63
63 -
 64
64 -
 65
65 -
 66
66 -
 67
67 -
 68
68 -
 69
69 -
 70
70 -
 71
71 -
 72
72 -
 73
73 -
 74
74 -
 75
75 -
 76
76 -
 77
77 -
78
-
79
-
80
-
81
-
82
-
83
-
84
-
85
-
86
-
87
-
88
-
89
-
90
-
91
-
92
-
93
-
94
-
95
-
96
-
97
-
98
-
99
-
100
-
101
-
102
-
103
-
104
-
105
-
106
-
107
-
108
-
109
-
110
-
111
-
112
-
113
-
114
-
115
-
116
-
117
-
118
-
119
-
120
-
121
-
122
-
123
-
124
-
125
-
126
-
127
-
128
-
129
-
130
-
131
-
132
-
133
-
134
-
135
-
136
-
137
-
138
-
139
-
140
-
141
-
142
-
143
-
144
-
145
-
146
-
147
-
148
-
149
-
150
-
151
-
152
-
153
-
154
-
155
-
156
-
157
-
158
-
159
-
160
-
161
-
162
-
163
-
164
-
165
-
166
-
167
-
168
-
169
-
170
-
171
-
172
-
173
-
174
-
175
-
176
-
177
-
178
-
179
-
180
-
181
-
182
-
183
-
184
-
185
-
186
-
187
-
188
-
189
-
190
-
191
-
192
-
193
-
194
-
195
-
196
-
197
-
198
-
199
-
200
-
201
-
202
-
203
-
204
-
205
-
206
-
207
-
208
-
209
-
210
-
211
-
212
-
213
-
214
-
215
-
216
-
217
-
218
-
219
-
220
-
221
-
222
-
223
-
224
-
225
-
226
-
227
-
228
-
229
-
230
-
231
-
232
-
233
-
234
-
235
-
236
-
237
-
238
-
239
-
240
-
241
-
242
-
243
-
244
-
245
-
246
-
247
-
248
 |
 |
67
Fee Income
Fee income is largely driven from amounts collected as a result of contractually defined percentages of assets under management. These
fees are generally collected on a daily basis. For individual life insurance products, fees are contractually defined as percentages based
on levels of insurance, age, premiums and deposits collected and contract holder value. Life insurance fees are generally collected on a
monthly basis. Therefore, the growth in assets under management either through positive net flows or net sales, or favorable equity
market performance will have a favorable impact on fee income. Conversely, either negative net flows or net sales, or unfavorable
equity market performance will reduce fee income.
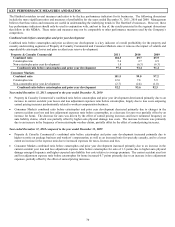
Loss and loss adjustment expense ratio
The loss and loss adjustment expense ratio is a measure of the cost of claims incurred in the calendar year divided by earned premium
and includes losses incurred for both the current and prior accident years, as well as the costs of mortality and morbidity and other
contractholder benefits to policyholders. Since Group Benefits occasionally buys a block of claims for a stated premium amount, the
Company excludes this buyout from the loss ratio used for evaluating the underwriting results of the business as buyouts may distort the
loss ratio. Among other factors, the loss and loss adjustment expense ratio needed for the Company to achieve its targeted return on
equity fluctuates from year to year based on changes in the expected investment yield over the claim settlement period, the timing of
expected claim settlements and the targeted returns set by management based on the competitive environment.
The loss and loss adjustment expense ratio is affected by claim frequency and claim severity, particularly for shorter-tail property lines
of business, where the emergence of claim frequency and severity is credible and likely indicative of ultimate losses. Claim frequency
represents the percentage change in the average number of reported claims per unit of exposure in the current accident year compared to
that of the previous accident year. Claim severity represents the percentage change in the estimated average cost per claim in the current
accident year compared to that of the previous accident year. As one of the factors used to determine pricing, the Company’ s practice is
to first make an overall assumption about claim frequency and severity for a given line of business and then, as part of the ratemaking
process, adjust the assumption as appropriate for the particular state, product or coverage.
Loss ratio, excluding buyouts
The loss ratio is utilized for the Group Benefits segment and is expressed as a ratio of benefits, losses and loss adjustment expenses to
premiums and other considerations, excluding buyout premiums. Buyout premiums represent takeover of open claim liabilities and
other non-recurring premium amounts.
Mutual Fund Assets
Mutual fund assets include retail, investment-only and college savings plan assets under Section 529 of the Code, collectively referred to
as non-proprietary, and proprietary mutual funds. Non-proprietary mutual fund assets are owned by the shareholders of those funds and
not by the Company. Proprietary mutual funds include mutual funds sponsored by the Company which are owned by the separate
accounts of the Company to support insurance and investment products sold by the Company. The non-proprietary mutual fund assets
are not reflected in the Company’ s consolidated financial statements. Mutual fund assets are a measure used by the Company because a
significant portion of the Company’ s revenues are based upon asset values. These revenues increase or decrease with a rise or fall in the
amount of account value whether caused by changes in the market or through net flows.
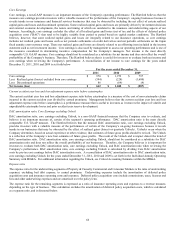
Net Investment Spread
Management evaluates performance of certain products based on net investment spread. These products include those that have
insignificant mortality risk, such as fixed annuities, certain general account universal life contracts and certain institutional contracts.
Net investment spread is determined by taking the difference between the earned rate (excluding the effects of realized capital gains and
losses, including those related to the Company’ s GMWB product and related reinsurance and hedging programs) and the related
crediting rates on average general account assets under management. The net investment spreads are for the total portfolio of relevant
contracts in each segment and reflect business written at different times. When pricing products, the Company considers current
investment yields and not the portfolio average. The determination of credited rates is based upon consideration of current market rates
for similar products, portfolio yields and contractually guaranteed minimum credited rates. Net investment spread can be volatile period
over period, which can have a significant positive or negative effect on the operating results of each segment. The volatile nature of net
investment spread is driven primarily by earnings on limited partnership and other alternative investments and prepayment premiums on
securities. Investment earnings can also be influenced by factors such as changes in interest rates, credit spreads and decisions to hold
higher levels of short-term investments. Net investment spread is calculated by dividing net investment earnings by average reserves
using a 13-point average, less interest credited divided by average account value using a 13-point average.
New business written premium
New business written premium represents the amount of premiums charged for policies issues to customers who were not insured with
the Company in the previous policy term. New business written premium plus renewal policy written premium equals total written
premium.