The Hartford 2011 Annual Report Download - page 100
Download and view the complete annual report
Please find page 100 of the 2011 The Hartford annual report below. You can navigate through the pages in the report by either clicking on the pages listed below, or by using the keyword search tool below to find specific information within the annual report.-
 1
1 -
2
-
3
-
4
-
5
-
6
-
7
-
8
-
9
-
10
-
11
-
12
-
13
-
14
-
15
-
16
-
17
-
18
-
19
-
20
-
21
-
22
-
23
-
24
-
25
-
26
-
27
-
28
-
29
-
30
-
31
-
32
-
33
-
34
-
35
-
36
-
37
-
38
-
39
-
40
-
41
-
42
-
43
-
44
-
45
-
46
-
47
-
48
-
49
-
50
-
51
-
52
-
53
-
54
-
55
-
56
-
57
-
58
-
59
-
60
-
61
-
62
-
63
-
64
-
65
-
66
-
67
-
68
-
69
-
70
-
71
-
72
-
73
-
74
-
75
-
76
-
77
-
78
-
79
-
80
-
81
-
82
-
83
-
84
-
85
-
86
-
87
-
88
-
89
-
 90
90 -
 91
91 -
 92
92 -
 93
93 -
 94
94 -
 95
95 -
 96
96 -
 97
97 -
 98
98 -
 99
99 -
 100
100 -
 101
101 -
 102
102 -
 103
103 -
 104
104 -
 105
105 -
 106
106 -
 107
107 -
 108
108 -
 109
109 -
 110
110 -
111
-
112
-
113
-
114
-
115
-
116
-
117
-
118
-
119
-
120
-
121
-
122
-
123
-
124
-
125
-
126
-
127
-
128
-
129
-
130
-
131
-
132
-
133
-
134
-
135
-
136
-
137
-
138
-
139
-
140
-
141
-
142
-
143
-
144
-
145
-
146
-
147
-
148
-
149
-
150
-
151
-
152
-
153
-
154
-
155
-
156
-
157
-
158
-
159
-
160
-
161
-
162
-
163
-
164
-
165
-
166
-
167
-
168
-
169
-
170
-
171
-
172
-
173
-
174
-
175
-
176
-
177
-
178
-
179
-
180
-
181
-
182
-
183
-
184
-
185
-
186
-
187
-
188
-
189
-
190
-
191
-
192
-
193
-
194
-
195
-
196
-
197
-
198
-
199
-
200
-
201
-
202
-
203
-
204
-
205
-
206
-
207
-
208
-
209
-
210
-
211
-
212
-
213
-
214
-
215
-
216
-
217
-
218
-
219
-
220
-
221
-
222
-
223
-
224
-
225
-
226
-
227
-
228
-
229
-
230
-
231
-
232
-
233
-
234
-
235
-
236
-
237
-
238
-
239
-
240
-
241
-
242
-
243
-
244
-
245
-
246
-
247
-
248
 |
 |
100
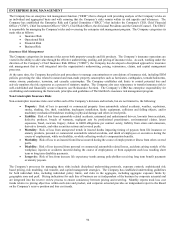
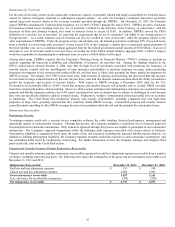
Liquidity Risk
Liquidity risk is the risk to current or prospective earnings or capital arising from the company’ s inability or perceived inability to meet
its contractual cash obligations at the legal entity level when they come due over given horizons without incurring unacceptable costs
and without relying on uncommitted funding sources. Liquidity risk includes the inability to manage unplanned increases or
accelerations in cash outflows, decreases or changes in funding sources, and changes in market conditions that affect the ability to
liquidate assets quickly to meet obligations with minimal loss in value. Components of liquidity risk include funding risk, transaction
risk and market liquidity risk. Funding risk is the gap between sources and uses of cash under normal and stressed conditions taking
into consideration structural, regulatory and legal entity constraints. Changes in institution-specific conditions that affect the Company’ s
ability to sell assets or otherwise transact business without incurring a significant loss in value is transaction risk. Changes in general
market conditions that affect the institution’ s ability to sell assets or otherwise transact business without incurring a significant loss in
value is market liquidity risk.
The Company has defined ongoing monitoring and reporting requirements to assess liquidity across the enterprise. The Company
measures and manages liquidity risk exposures and funding needs within prescribed limits and across legal entities, business lines and
currencies, taking into account legal, regulatory and operational limitations to the transferability of liquidity. The Company also
monitors internal and external conditions, identifies material risk changes and emerging risks that may impact liquidity. The
Company’ s CFO has primary responsibility for liquidity risk.
For further discussion on liquidity see the section on Capital Resources and Liquidity.
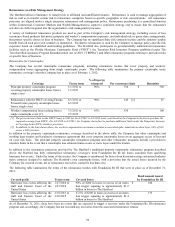
Interest Rate Risk
Interest rate risk is the risk of financial loss due to adverse changes in the value of assets and liabilities arising from movements in
interest rates. Interest rate risk encompasses exposures with respect to changes in the level of interest rates, the shape of the term
structure of rates and the volatility of interest rates. Interest rate risk does not include exposure to changes in credit spreads. The
Company has exposure to interest rates arising from its fixed securities, interest sensitive liabilities and discount rate assumptions
associated with the Company’ s pension and other post retirement benefit obligations.
An increase in interest rates from current levels is generally a favorable development for the Company. Rate increases are expected to
provide additional net investment income, increase sales of fixed rate Wealth Management and Life Other Operations investment
products, reduce the cost of the variable annuity hedging program, limit the potential risk of margin erosion due to minimum guaranteed
crediting rates in certain Wealth Management and Life Other Operations products and, if sustained, could reduce the Company’ s
prospective pension expense. Conversely, a rise in interest rates will reduce the fair value of the investment portfolio, increase interest
expense on the Company’ s variable rate debt obligations and, if long-term interest rates rise dramatically within a six to twelve month
time period, certain Wealth Management and Life Other Operations businesses may be exposed to disintermediation risk.
Disintermediation risk refers to the risk that policyholders will surrender their contracts in a rising interest rate environment requiring
the Company to liquidate assets in an unrealized loss position. In conjunction with the interest rate risk measurement and management
techniques, certain of Wealth Management and Life Other Operation’ s fixed income product offerings have market value adjustment
provisions at contract surrender. An increase in interest rates may also impact the Company’ s tax planning strategies and in particular
its ability to utilize tax benefits to offset certain previously recognized realized capital losses.
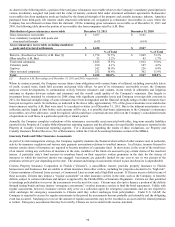
A decline in interest rates results in certain mortgage-backed securities being more susceptible to paydowns and prepayments. During
such periods, the Company generally will not be able to reinvest the proceeds at comparable yields. Lower interest rates will also likely
result in lower net investment income, increased hedging cost associated with variable annuities and, if declines are sustained for a long
period of time, it may subject the Company to reinvestment risks, higher pension costs expense and possibly reduced profit margins
associated with guaranteed crediting rates on certain Wealth Management and Life Other Operations products. Conversely, the fair
value of the investment portfolio will increase when interest rates decline and the Company’ s interest expense will be lower on its
variable rate debt obligations.
The Company manages its exposure to interest rate risk by constructing investment portfolios that maintain asset allocation limits and
asset/liability duration matching targets which may include the use of derivatives. The Company analyzes interest rate risk using
various models including parametric models and cash flow simulation under various market scenarios of the liabilities and their
supporting investment portfolios, which may include derivative instruments. Measures the Company uses to quantify its exposure to
interest rate risk inherent in its invested assets and interest rate sensitive liabilities include duration, convexity and key rate duration.
Duration is the price sensitivity of a financial instrument or series of cash flows to a parallel change in the underlying yield curve used
to value the financial instrument or series of cash flows. For example, a duration of 5 means the price of the security will change by
approximately 5% for a 100 basis point change in interest rates. Convexity is used to approximate how the duration of a security
changes as interest rates change in a parallel manner. Key rate duration analysis measures the price sensitivity of a security or series of
cash flows to each point along the yield curve and enables the Company to estimate the price change of a security assuming non-parallel
interest rate movements.