The Hartford 2011 Annual Report Download - page 76
Download and view the complete annual report
Please find page 76 of the 2011 The Hartford annual report below. You can navigate through the pages in the report by either clicking on the pages listed below, or by using the keyword search tool below to find specific information within the annual report.-
 1
1 -
2
-
3
-
4
-
5
-
6
-
7
-
8
-
9
-
10
-
11
-
12
-
13
-
14
-
15
-
16
-
17
-
18
-
19
-
20
-
21
-
22
-
23
-
24
-
25
-
26
-
27
-
28
-
29
-
30
-
31
-
32
-
33
-
34
-
35
-
36
-
37
-
38
-
39
-
40
-
41
-
42
-
43
-
44
-
45
-
46
-
47
-
48
-
49
-
50
-
51
-
52
-
53
-
54
-
55
-
56
-
57
-
58
-
59
-
60
-
61
-
62
-
63
-
64
-
65
-
 66
66 -
 67
67 -
 68
68 -
 69
69 -
 70
70 -
 71
71 -
 72
72 -
 73
73 -
 74
74 -
 75
75 -
 76
76 -
 77
77 -
 78
78 -
 79
79 -
 80
80 -
 81
81 -
 82
82 -
 83
83 -
 84
84 -
 85
85 -
 86
86 -
87
-
88
-
89
-
90
-
91
-
92
-
93
-
94
-
95
-
96
-
97
-
98
-
99
-
100
-
101
-
102
-
103
-
104
-
105
-
106
-
107
-
108
-
109
-
110
-
111
-
112
-
113
-
114
-
115
-
116
-
117
-
118
-
119
-
120
-
121
-
122
-
123
-
124
-
125
-
126
-
127
-
128
-
129
-
130
-
131
-
132
-
133
-
134
-
135
-
136
-
137
-
138
-
139
-
140
-
141
-
142
-
143
-
144
-
145
-
146
-
147
-
148
-
149
-
150
-
151
-
152
-
153
-
154
-
155
-
156
-
157
-
158
-
159
-
160
-
161
-
162
-
163
-
164
-
165
-
166
-
167
-
168
-
169
-
170
-
171
-
172
-
173
-
174
-
175
-
176
-
177
-
178
-
179
-
180
-
181
-
182
-
183
-
184
-
185
-
186
-
187
-
188
-
189
-
190
-
191
-
192
-
193
-
194
-
195
-
196
-
197
-
198
-
199
-
200
-
201
-
202
-
203
-
204
-
205
-
206
-
207
-
208
-
209
-
210
-
211
-
212
-
213
-
214
-
215
-
216
-
217
-
218
-
219
-
220
-
221
-
222
-
223
-
224
-
225
-
226
-
227
-
228
-
229
-
230
-
231
-
232
-
233
-
234
-
235
-
236
-
237
-
238
-
239
-
240
-
241
-
242
-
243
-
244
-
245
-
246
-
247
-
248
 |
 |

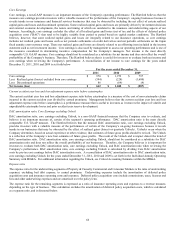
76
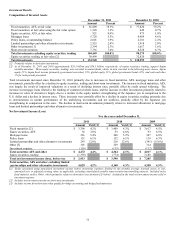
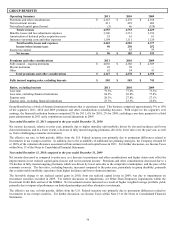
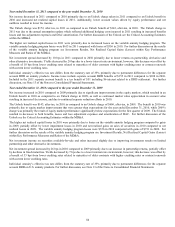
PROPERTY & CASUALTY COMMERCIAL
Underwriting Summary
2011
2010
2009
Written premiums
$
6,176
$
5,796
$
5,715
Change in unearned premium reserve
49
52
(188)
Earned premiums
6,127
5,744
5,903
Losses and loss adjustment expenses
Current accident year before catastrophes
4,139
3,579
3,582
Current accident year catastrophes
320
152
78
Prior accident years
125
(361)
(394)
Total losses and loss adjustment expenses
4,584
3,370
3,266
Amortization of deferred policy acquisition costs
1,356
1,353
1,393
Underwriting expenses
443
426
399
Dividends to policyholders
18
5
10
Underwriting results
(274)
590
835
Net servicing income
13
9
6
Net investment income
910
935
755
Net realized capital gains (losses)
(50)
3
(209)
Goodwill impairment
(30)
—
—
Other expenses
(151)
(147)
(139)
Income from continuing operations before income taxes
418
1,390
1,248
Income tax expense
40
407
356
Income from continuing operations, net of tax
378
983
892
Income from discontinued operations, net of tax [1]
150
12
7
Net income
$
528
$
995
$
899
[1] Represents the income from operations and sale of Specialty Risk Services (“SRS”). For additional information, see Note 20 of the Notes to
Consolidated Financial Statements.
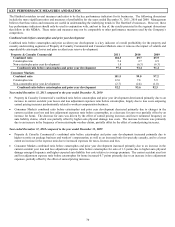
Premium Measures [1]
2011
2010
2009
New business premium
$
1,097
$
1,122
$
1,101
Standard commercial lines policy count retention
82%
84%
81%
Standard commercial lines renewal written pricing increase (decrease)
4%
1%
(1%)
Standard commercial lines renewal earned pricing increase (decrease)
2%
—
(2%)
Standard commercial lines policies in-force as of end of period
1,252,820
1,211,047
1,159,759
[1] Standard commercial lines represents the Company’s small commercial and middle market property and casualty lines.
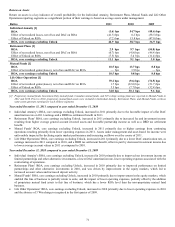
Ratios
2011
2010
2009
Loss and loss adjustment expense ratio
Current accident year before catastrophes
67.6
62.3
60.7
Current accident year catastrophes
5.2
2.7
1.3
Prior accident years
2.0
(6.3)
(6.7)
Total loss and loss adjustment expense ratio
74.8
58.7
55.3
Expense ratio
29.4
31.0
30.4
Policyholder dividend ratio
0.3
0.1
0.2
Combined ratio
104.5
89.7
85.9
Catastrophe ratio
Current accident year
5.2
2.7
1.3
Prior accident years
0.2
—
(0.4)
Total catastrophe ratio
5.4
2.7
0.9
Combined ratio before catastrophes
99.1
87.1
84.9
Combined ratio before catastrophes and prior accident year
development
97.2
93.4
91.2
Other revenues [1]
$
97
$
96
$
103
[1] Represents servicing revenues.