The Hartford 2011 Annual Report Download - page 181
Download and view the complete annual report
Please find page 181 of the 2011 The Hartford annual report below. You can navigate through the pages in the report by either clicking on the pages listed below, or by using the keyword search tool below to find specific information within the annual report.-
 1
1 -
2
-
3
-
4
-
5
-
6
-
7
-
8
-
9
-
10
-
11
-
12
-
13
-
14
-
15
-
16
-
17
-
18
-
19
-
20
-
21
-
22
-
23
-
24
-
25
-
26
-
27
-
28
-
29
-
30
-
31
-
32
-
33
-
34
-
35
-
36
-
37
-
38
-
39
-
40
-
41
-
42
-
43
-
44
-
45
-
46
-
47
-
48
-
49
-
50
-
51
-
52
-
53
-
54
-
55
-
56
-
57
-
58
-
59
-
60
-
61
-
62
-
63
-
64
-
65
-
66
-
67
-
68
-
69
-
70
-
71
-
72
-
73
-
74
-
75
-
76
-
77
-
78
-
79
-
80
-
81
-
82
-
83
-
84
-
85
-
86
-
87
-
88
-
89
-
90
-
91
-
92
-
93
-
94
-
95
-
96
-
97
-
98
-
99
-
100
-
101
-
102
-
103
-
104
-
105
-
106
-
107
-
108
-
109
-
110
-
111
-
112
-
113
-
114
-
115
-
116
-
117
-
118
-
119
-
120
-
121
-
122
-
123
-
124
-
125
-
126
-
127
-
128
-
129
-
130
-
131
-
132
-
133
-
134
-
135
-
136
-
137
-
138
-
139
-
140
-
141
-
142
-
143
-
144
-
145
-
146
-
147
-
148
-
149
-
150
-
151
-
152
-
153
-
154
-
155
-
156
-
157
-
158
-
159
-
160
-
161
-
162
-
163
-
164
-
165
-
166
-
167
-
168
-
169
-
170
-
 171
171 -
 172
172 -
 173
173 -
 174
174 -
 175
175 -
 176
176 -
 177
177 -
 178
178 -
 179
179 -
 180
180 -
 181
181 -
 182
182 -
 183
183 -
 184
184 -
 185
185 -
 186
186 -
 187
187 -
 188
188 -
 189
189 -
 190
190 -
 191
191 -
192
-
193
-
194
-
195
-
196
-
197
-
198
-
199
-
200
-
201
-
202
-
203
-
204
-
205
-
206
-
207
-
208
-
209
-
210
-
211
-
212
-
213
-
214
-
215
-
216
-
217
-
218
-
219
-
220
-
221
-
222
-
223
-
224
-
225
-
226
-
227
-
228
-
229
-
230
-
231
-
232
-
233
-
234
-
235
-
236
-
237
-
238
-
239
-
240
-
241
-
242
-
243
-
244
-
245
-
246
-
247
-
248
 |
 |

THE HARTFORD FINANCIAL SERVICES GROUP, INC.
NOTES TO CONSOLIDATED FINANCIAL STATEMENTS (continued)
F-46
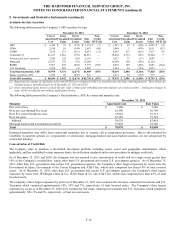
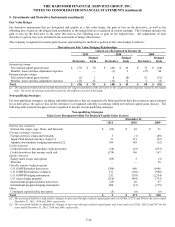
5. Investments and Derivative Instruments (continued)
Fair Value Hedges
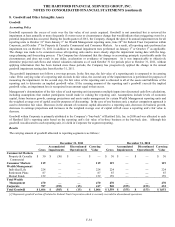
For derivative instruments that are designated and qualify as a fair value hedge, the gain or loss on the derivative, as well as the
offsetting loss or gain on the hedged item attributable to the hedged risk are recognized in current earnings. The Company includes the
gain or loss on the derivative in the same line item as the offsetting loss or gain on the hedged item. All components of each
derivative’ s gain or loss were included in the assessment of hedge effectiveness.
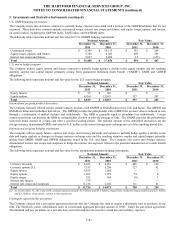
The Company recognized in income gains (losses) representing the ineffective portion of fair value hedges as follows:
Derivatives in Fair Value Hedging Relationships
Gain (Loss) Recognized in Income [1]
2011
2010
2009
Derivative
Hedged
Item
Derivative
Hedged
Item
Derivative
Hedged
Item
Interest rate swaps
Net realized capital gains (losses)
$
(73)
$
70
$
(43)
$
36
$
72
$
(68)
Benefits, losses and loss adjustment expenses
—
—
(1)
3
(37)
40
Foreign currency swaps
Net realized capital gains (losses)
(1)
1
8
(8)
51
(51)
Benefits, losses and loss adjustment expenses
(22)
22
(12)
12
2
(2)
Total
$
(96)
$
93
$
(48)
$
43
$
88
$
(81)
[1] The amounts presented do not include the periodic net coupon settlements of the derivative or the coupon income (expense) related to the hedged
item. The net of the amounts presented represents the ineffective portion of the hedge.
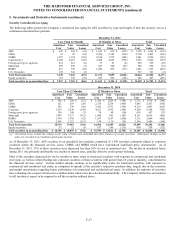
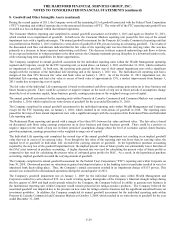
Non-qualifying Strategies
For non-qualifying strategies, including embedded derivatives that are required to be bifurcated from their host contracts and accounted
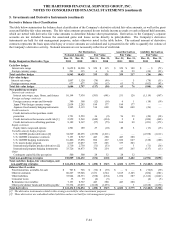
for as derivatives, the gain or loss on the derivative is recognized currently in earnings within net realized capital gains (losses). The
following table presents the gain or loss recognized in income on non-qualifying strategies:
Non-qualifying Strategies
Gain (Loss) Recognized within Net Realized Capital Gains (Losses)
December 31,
2011
2010
2009
Interest rate contracts
Interest rate swaps, caps, floors, and forwards
$
(22)
$
45
$
31
Foreign exchange contracts
Foreign currency swaps and forwards
3
(1)
(49)
Japan 3Win foreign currency swaps [1]
31
215
(22)
Japanese fixed annuity hedging instruments [2]
109
385
(12)
Credit contracts
Credit derivatives that purchase credit protection
(10)
(23)
(533)
Credit derivatives that assume credit risk
(174)
196
167
Equity contracts
Equity index swaps and options
(89)
5
(3)
Warrants
—
—
70
Variable annuity hedge program
U.S. GMWB product derivatives
(780)
486
4,686
U.S. GMWB reinsurance contracts
131
(102)
(988)
U.S. GMWB hedging instruments
252
(295)
(2,234)
U.S. macro hedge program
(216)
(445)
(733)
International program product derivatives
(25)
26
67
International program hedging instruments
800
(15)
(179)
Other
Contingent capital facility put option
(5)
(6)
(8)
Total
$
5
$
471
$
260
[1] The associated liability is adjusted for changes in spot rates through realized capital gains and was ($100), ($273) and $64 for the years ended
December 31, 2011, 2010 and 2009, respectively.
[2] The associated liability is adjusted for changes in spot rates through realized capital gains and losses and was ($129), ($332) and $67 for the
years ended December 31, 2011, 2010 and 2009, respectively.