The Hartford 2011 Annual Report Download - page 52
Download and view the complete annual report
Please find page 52 of the 2011 The Hartford annual report below. You can navigate through the pages in the report by either clicking on the pages listed below, or by using the keyword search tool below to find specific information within the annual report.-
 1
1 -
2
-
3
-
4
-
5
-
6
-
7
-
8
-
9
-
10
-
11
-
12
-
13
-
14
-
15
-
16
-
17
-
18
-
19
-
20
-
21
-
22
-
23
-
24
-
25
-
26
-
27
-
28
-
29
-
30
-
31
-
32
-
33
-
34
-
35
-
36
-
37
-
38
-
39
-
40
-
41
-
 42
42 -
 43
43 -
 44
44 -
 45
45 -
 46
46 -
 47
47 -
 48
48 -
 49
49 -
 50
50 -
 51
51 -
 52
52 -
 53
53 -
 54
54 -
 55
55 -
 56
56 -
 57
57 -
 58
58 -
 59
59 -
 60
60 -
 61
61 -
 62
62 -
63
-
64
-
65
-
66
-
67
-
68
-
69
-
70
-
71
-
72
-
73
-
74
-
75
-
76
-
77
-
78
-
79
-
80
-
81
-
82
-
83
-
84
-
85
-
86
-
87
-
88
-
89
-
90
-
91
-
92
-
93
-
94
-
95
-
96
-
97
-
98
-
99
-
100
-
101
-
102
-
103
-
104
-
105
-
106
-
107
-
108
-
109
-
110
-
111
-
112
-
113
-
114
-
115
-
116
-
117
-
118
-
119
-
120
-
121
-
122
-
123
-
124
-
125
-
126
-
127
-
128
-
129
-
130
-
131
-
132
-
133
-
134
-
135
-
136
-
137
-
138
-
139
-
140
-
141
-
142
-
143
-
144
-
145
-
146
-
147
-
148
-
149
-
150
-
151
-
152
-
153
-
154
-
155
-
156
-
157
-
158
-
159
-
160
-
161
-
162
-
163
-
164
-
165
-
166
-
167
-
168
-
169
-
170
-
171
-
172
-
173
-
174
-
175
-
176
-
177
-
178
-
179
-
180
-
181
-
182
-
183
-
184
-
185
-
186
-
187
-
188
-
189
-
190
-
191
-
192
-
193
-
194
-
195
-
196
-
197
-
198
-
199
-
200
-
201
-
202
-
203
-
204
-
205
-
206
-
207
-
208
-
209
-
210
-
211
-
212
-
213
-
214
-
215
-
216
-
217
-
218
-
219
-
220
-
221
-
222
-
223
-
224
-
225
-
226
-
227
-
228
-
229
-
230
-
231
-
232
-
233
-
234
-
235
-
236
-
237
-
238
-
239
-
240
-
241
-
242
-
243
-
244
-
245
-
246
-
247
-
248
 |
 |

52
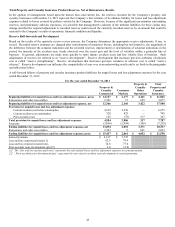
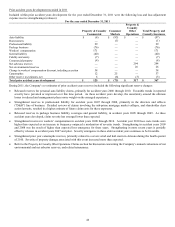
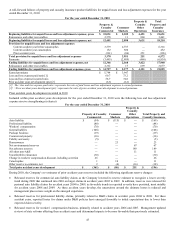
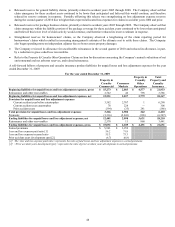
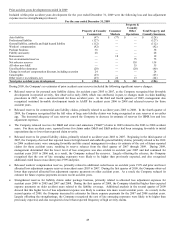
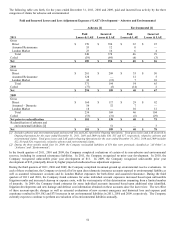
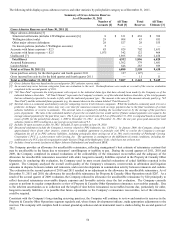
The following table sets forth, for the years ended December 31, 2011, 2010 and 2009, paid and incurred loss activity by the three
categories of claims for asbestos and environmental.
Paid and Incurred Losses and Loss Adjustment Expenses (“LAE”) Development – Asbestos and Environmental
Asbestos [1]
Environmental [1]
2011
Paid
Losses & LAE
Incurred
Losses & LAE
Paid
Losses & LAE
Incurred
Losses & LAE
Gross
Direct $
170 $ 350 $ 32 $ 25
Assumed Reinsurance
55
12
8
—
London Market
23
16
6
4
Total
248
378
46
29
Ceded
(59)
(84)
(6)
(3)
Net
$
189
$
294
$
40
$
26
2010
Gross
Direct
$
201
$
209
$
35
$
50
Assumed Reinsurance 128 — 12 5
London Market
42
(15)
7
10
Total
371
194
54
65
Ceded
(77)
(5)
(14)
2
Net
$
294
$
189
$
40
$
67
2009
Gross
Direct
$
160
$
117
$
29
$
92
Assumed – Domestic
56
52
7
—
London Market
18
—
10
12
Total
234
169
46
104
Ceded
(53)
(31)
(6)
(29)
Net prior to reclassification
$
181
$
138
$
40
$
75
Reclassification of asbestos and
environmental liabilities [2]
—
51
—
3
Net
$
181
$
189
$
40
$
78
[1] Excludes asbestos and environmental paid and incurred loss and LAE reported in Ongoing Operations. Total gross losses and LAE incurred in
Ongoing Operations for the years ended December 31, 2011, 2010 and 2009 includes $30, $15 and $17, respectively, related to asbestos and
environmental claims. Total gross losses and LAE paid in Ongoing Operations for the years ended December 31, 2011, 2010 and 2009 includes
$22, $14 and $20, respectively, related to asbestos and environmental claims.
[2] During the three months ended June 30, 2009, the Company reclassified liabilities of $54 that were previously classified as “All Other” to
“Asbestos” and “Environmental”.
In the fourth quarters of 2011, 2010 and 2009, the Company completed evaluations of certain of its non-asbestos and environmental
reserves, including its assumed reinsurance liabilities. In 2011, the Company recognized no prior year development. In 2010, the
Company recognized unfavorable prior year development of $11. In 2009, the Company recognized unfavorable prior year
development of $35, principally driven by higher projected unallocated loss adjustment expenses.
During the third quarters of 2011, 2010 and 2009, the Company completed its annual ground up environmental reserve evaluations. In
each of these evaluations, the Company reviewed all of its open direct domestic insurance accounts exposed to environmental liability as
well as assumed reinsurance accounts and its London Market exposures for both direct and assumed reinsurance. During the third
quarters of 2011 and 2010, the Company found estimates for some individual account exposures increased based upon unfavorable
litigation results and increased clean-up or expense costs, with the vast majority of this deterioration emanating from a limited number
of insureds. In 2009, the Company found estimates for some individual accounts increased based upon additional sites identified,
litigation developments and new damage and defense cost information obtained on these accounts since the last review. The net effect
of these account-specific changes as well as actuarial evaluations of new account emergence and historical loss and expense paid
experience resulted in $19, $62 and $75 increases in net environmental liabilities in 2011, 2010 and 2009, respectively. The Company
currently expects to continue to perform an evaluation of its environmental liabilities annually.