The Hartford 2011 Annual Report Download - page 146
Download and view the complete annual report
Please find page 146 of the 2011 The Hartford annual report below. You can navigate through the pages in the report by either clicking on the pages listed below, or by using the keyword search tool below to find specific information within the annual report.-
 1
1 -
2
-
3
-
4
-
5
-
6
-
7
-
8
-
9
-
10
-
11
-
12
-
13
-
14
-
15
-
16
-
17
-
18
-
19
-
20
-
21
-
22
-
23
-
24
-
25
-
26
-
27
-
28
-
29
-
30
-
31
-
32
-
33
-
34
-
35
-
36
-
37
-
38
-
39
-
40
-
41
-
42
-
43
-
44
-
45
-
46
-
47
-
48
-
49
-
50
-
51
-
52
-
53
-
54
-
55
-
56
-
57
-
58
-
59
-
60
-
61
-
62
-
63
-
64
-
65
-
66
-
67
-
68
-
69
-
70
-
71
-
72
-
73
-
74
-
75
-
76
-
77
-
78
-
79
-
80
-
81
-
82
-
83
-
84
-
85
-
86
-
87
-
88
-
89
-
90
-
91
-
92
-
93
-
94
-
95
-
96
-
97
-
98
-
99
-
100
-
101
-
102
-
103
-
104
-
105
-
106
-
107
-
108
-
109
-
110
-
111
-
112
-
113
-
114
-
115
-
116
-
117
-
118
-
119
-
120
-
121
-
122
-
123
-
124
-
125
-
126
-
127
-
128
-
129
-
130
-
131
-
132
-
133
-
134
-
135
-
 136
136 -
 137
137 -
 138
138 -
 139
139 -
 140
140 -
 141
141 -
 142
142 -
 143
143 -
 144
144 -
 145
145 -
 146
146 -
 147
147 -
 148
148 -
 149
149 -
 150
150 -
 151
151 -
 152
152 -
 153
153 -
 154
154 -
 155
155 -
 156
156 -
157
-
158
-
159
-
160
-
161
-
162
-
163
-
164
-
165
-
166
-
167
-
168
-
169
-
170
-
171
-
172
-
173
-
174
-
175
-
176
-
177
-
178
-
179
-
180
-
181
-
182
-
183
-
184
-
185
-
186
-
187
-
188
-
189
-
190
-
191
-
192
-
193
-
194
-
195
-
196
-
197
-
198
-
199
-
200
-
201
-
202
-
203
-
204
-
205
-
206
-
207
-
208
-
209
-
210
-
211
-
212
-
213
-
214
-
215
-
216
-
217
-
218
-
219
-
220
-
221
-
222
-
223
-
224
-
225
-
226
-
227
-
228
-
229
-
230
-
231
-
232
-
233
-
234
-
235
-
236
-
237
-
238
-
239
-
240
-
241
-
242
-
243
-
244
-
245
-
246
-
247
-
248
 |
 |

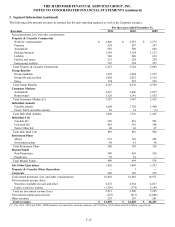
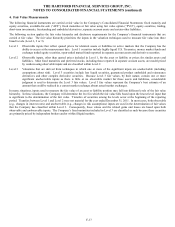
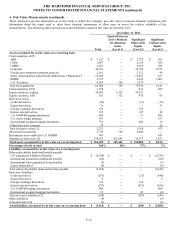
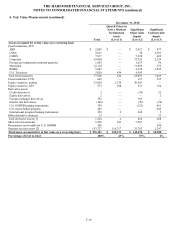
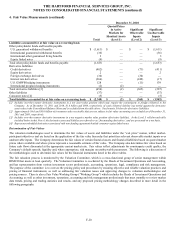
THE HARTFORD FINANCIAL SERVICES GROUP, INC.
NOTES TO CONSOLIDATED FINANCIAL STATEMENTS (continued)
F-11
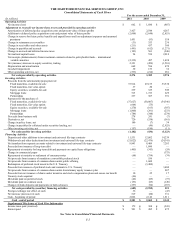
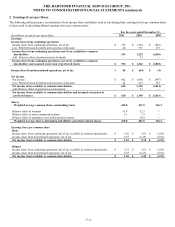
2. Earnings (Loss) per Share
The following tables present a reconciliation of net income (loss) and shares used in calculating basic earnings (loss) per common share
to those used in calculating diluted earnings (loss) per common share.
For the years ended December 31,
(In millions, except for per share data)
2011
2010
2009
Earnings
Income (loss) from continuing operations
Income (loss) from continuing operations, net of tax
$
576
$
1,744
$
(883)
Less: Preferred stock dividends and accretion of discount
42
515
127
Income (loss) from continuing operations, net of tax, available to common
shareholders
534
1,229
(1,010)
Add: Dilutive effect of preferred stock dividends
—
33
—
Income (loss) from continuing operations, net of tax, available to common
shareholders and assumed conversion of preferred shares
$
534
$
1,262
$
(1,010)
Income (loss) from discontinued operations, net of tax
$
86
$
(64)
$
(4)
Net income
Net income
$
662
$
1,680
$
(887)
Less: Preferred stock dividends and accretion of discount
42
515
127
Net income (loss) available to common shareholders
620
1,165
(1,014)
Add: Dilutive effect of preferred stock dividends
—
33
—
Net income (loss) available to common shareholders and assumed conversion of
preferred shares
$
620
$
1,198
$
(1,014)
Shares
Weighted average common shares outstanding, basic
445.0
431.5
346.3
Dilutive effect of warrants
31.9
32.3
—
Dilutive effect of stock compensation plans
1.1
1.3
—
Dilutive effect of mandatory convertible preferred shares
—
16.4
—
Weighted average shares outstanding and dilutive potential common shares
478.0
481.5
346.3
Earnings (loss) per common share
Basic
Income (loss) from continuing operations, net of tax, available to common shareholders
$
1.20
$
2.85
$
(2.92)
Income (loss) from discontinued operations, net of tax
0.19
(0.15)
(0.01)
Net income (loss) available to common shareholders
$
1.39
$
2.70
$
(2.93)
Diluted
Income (loss) from continuing operations, net of tax, available to common shareholders
$
1.12
$
2.62
$
(2.92)
Income (loss) from discontinued operations, net of tax
0.18
(0.13)
(0.01)
Net income (loss) available to common shareholders
$
1.30
$
2.49
$
(2.93)