The Hartford 2011 Annual Report Download - page 218
Download and view the complete annual report
Please find page 218 of the 2011 The Hartford annual report below. You can navigate through the pages in the report by either clicking on the pages listed below, or by using the keyword search tool below to find specific information within the annual report.-
 1
1 -
2
-
3
-
4
-
5
-
6
-
7
-
8
-
9
-
10
-
11
-
12
-
13
-
14
-
15
-
16
-
17
-
18
-
19
-
20
-
21
-
22
-
23
-
24
-
25
-
26
-
27
-
28
-
29
-
30
-
31
-
32
-
33
-
34
-
35
-
36
-
37
-
38
-
39
-
40
-
41
-
42
-
43
-
44
-
45
-
46
-
47
-
48
-
49
-
50
-
51
-
52
-
53
-
54
-
55
-
56
-
57
-
58
-
59
-
60
-
61
-
62
-
63
-
64
-
65
-
66
-
67
-
68
-
69
-
70
-
71
-
72
-
73
-
74
-
75
-
76
-
77
-
78
-
79
-
80
-
81
-
82
-
83
-
84
-
85
-
86
-
87
-
88
-
89
-
90
-
91
-
92
-
93
-
94
-
95
-
96
-
97
-
98
-
99
-
100
-
101
-
102
-
103
-
104
-
105
-
106
-
107
-
108
-
109
-
110
-
111
-
112
-
113
-
114
-
115
-
116
-
117
-
118
-
119
-
120
-
121
-
122
-
123
-
124
-
125
-
126
-
127
-
128
-
129
-
130
-
131
-
132
-
133
-
134
-
135
-
136
-
137
-
138
-
139
-
140
-
141
-
142
-
143
-
144
-
145
-
146
-
147
-
148
-
149
-
150
-
151
-
152
-
153
-
154
-
155
-
156
-
157
-
158
-
159
-
160
-
161
-
162
-
163
-
164
-
165
-
166
-
167
-
168
-
169
-
170
-
171
-
172
-
173
-
174
-
175
-
176
-
177
-
178
-
179
-
180
-
181
-
182
-
183
-
184
-
185
-
186
-
187
-
188
-
189
-
190
-
191
-
192
-
193
-
194
-
195
-
196
-
197
-
198
-
199
-
200
-
201
-
202
-
203
-
204
-
205
-
206
-
207
-
 208
208 -
 209
209 -
 210
210 -
 211
211 -
 212
212 -
 213
213 -
 214
214 -
 215
215 -
 216
216 -
 217
217 -
 218
218 -
 219
219 -
 220
220 -
 221
221 -
 222
222 -
 223
223 -
 224
224 -
 225
225 -
 226
226 -
 227
227 -
 228
228 -
229
-
230
-
231
-
232
-
233
-
234
-
235
-
236
-
237
-
238
-
239
-
240
-
241
-
242
-
243
-
244
-
245
-
246
-
247
-
248
 |
 |

THE HARTFORD FINANCIAL SERVICES GROUP, INC.
NOTES TO CONSOLIDATED FINANCIAL STATEMENTS (continued)
F-83
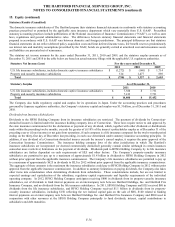
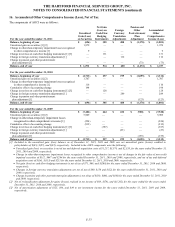
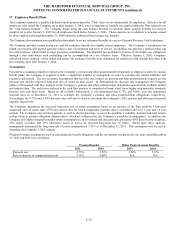
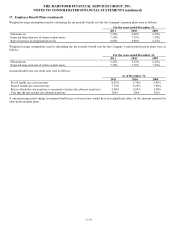
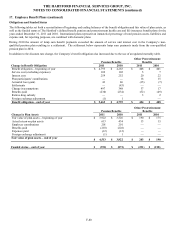
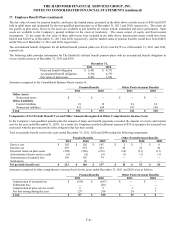
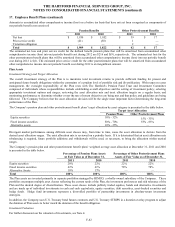
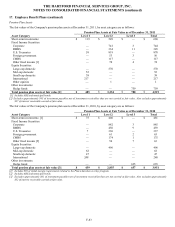
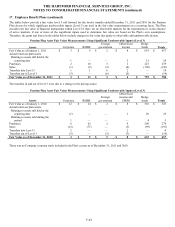
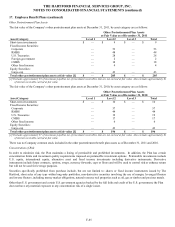
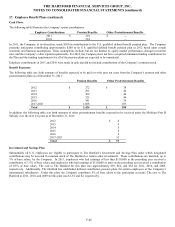
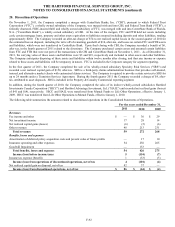
17. Employee Benefit Plans (continued)
Pension Plan Assets
The fair values of the Company's pension plan assets at December 31, 2011, by asset category are as follows:
Pension Plan Assets at Fair Value as of December 31, 2011
Asset Category
Level 1
Level 2
Level 3
Total
Short-term investments:
$
119
$
549
$
—
$
668
Fixed Income Securities:
Corporate
—
741
3
744
RMBS
—
334
11
345
U.S. Treasuries
59
819
—
878
Foreign government
—
53
3
56
CMBS
—
117
—
117
Other fixed income [1]
—
70
4
74
Equity Securities:
Large-cap domestic
—
570
—
570
Mid-cap domestic
52
—
—
52
Small-cap domestic
38
—
—
38
International
217
—
—
217
Other equities
—
1
—
1
Other investments:
Hedge funds
—
—
759
759
Total pension plan assets at fair value [2]
$
485
$
3,254
$
780
$
4,519
[1] Includes ABS and municipal bonds.
[2] Excludes approximately $43 of investment payables net of investment receivables that are not carried at fair value. Also excludes approximately
$37 of interest receivable carried at fair value.
The fair values of the Company's pension plan assets at December 31, 2010, by asset category are as follows:
Pension Plan Assets at Fair Value as of December 31, 2010
Asset Category
Level 1
Level 2
Level 3
Total
Short-term investments: [1]
$
75
$
406
$
—
$
481
Fixed Income Securities:
Corporate
—
882
3
885
RMBS
—
450
9
459
U.S. Treasuries
7
330
—
337
Foreign government
—
61
2
63
CMBS
—
174
1
175
Other fixed income [2]
—
56
7
63
Equity Securities:
Large-cap domestic
—
496
—
496
Mid-cap domestic
62
—
—
62
Small-cap domestic
47
—
—
47
International
248
—
—
248
Other investments:
Hedge funds
—
—
635
635
Total pension plan assets at fair value [3]
$
439
$
2,855
$
657
$
3,951
[1] Includes $30 of initial margin requirements related to the Plan’s duration overlay program.
[2] Includes ABS and municipal bonds.
[3] Excludes approximately $61 of investment payables net of investment receivables that are not carried at fair value. Also excludes approximately
$32 of interest receivable carried at fair value.