The Hartford 2011 Annual Report Download - page 72
Download and view the complete annual report
Please find page 72 of the 2011 The Hartford annual report below. You can navigate through the pages in the report by either clicking on the pages listed below, or by using the keyword search tool below to find specific information within the annual report.-
 1
1 -
2
-
3
-
4
-
5
-
6
-
7
-
8
-
9
-
10
-
11
-
12
-
13
-
14
-
15
-
16
-
17
-
18
-
19
-
20
-
21
-
22
-
23
-
24
-
25
-
26
-
27
-
28
-
29
-
30
-
31
-
32
-
33
-
34
-
35
-
36
-
37
-
38
-
39
-
40
-
41
-
42
-
43
-
44
-
45
-
46
-
47
-
48
-
49
-
50
-
51
-
52
-
53
-
54
-
55
-
56
-
57
-
58
-
59
-
60
-
61
-
 62
62 -
 63
63 -
 64
64 -
 65
65 -
 66
66 -
 67
67 -
 68
68 -
 69
69 -
 70
70 -
 71
71 -
 72
72 -
 73
73 -
 74
74 -
 75
75 -
 76
76 -
 77
77 -
 78
78 -
 79
79 -
 80
80 -
 81
81 -
 82
82 -
83
-
84
-
85
-
86
-
87
-
88
-
89
-
90
-
91
-
92
-
93
-
94
-
95
-
96
-
97
-
98
-
99
-
100
-
101
-
102
-
103
-
104
-
105
-
106
-
107
-
108
-
109
-
110
-
111
-
112
-
113
-
114
-
115
-
116
-
117
-
118
-
119
-
120
-
121
-
122
-
123
-
124
-
125
-
126
-
127
-
128
-
129
-
130
-
131
-
132
-
133
-
134
-
135
-
136
-
137
-
138
-
139
-
140
-
141
-
142
-
143
-
144
-
145
-
146
-
147
-
148
-
149
-
150
-
151
-
152
-
153
-
154
-
155
-
156
-
157
-
158
-
159
-
160
-
161
-
162
-
163
-
164
-
165
-
166
-
167
-
168
-
169
-
170
-
171
-
172
-
173
-
174
-
175
-
176
-
177
-
178
-
179
-
180
-
181
-
182
-
183
-
184
-
185
-
186
-
187
-
188
-
189
-
190
-
191
-
192
-
193
-
194
-
195
-
196
-
197
-
198
-
199
-
200
-
201
-
202
-
203
-
204
-
205
-
206
-
207
-
208
-
209
-
210
-
211
-
212
-
213
-
214
-
215
-
216
-
217
-
218
-
219
-
220
-
221
-
222
-
223
-
224
-
225
-
226
-
227
-
228
-
229
-
230
-
231
-
232
-
233
-
234
-
235
-
236
-
237
-
238
-
239
-
240
-
241
-
242
-
243
-
244
-
245
-
246
-
247
-
248
 |
 |

72
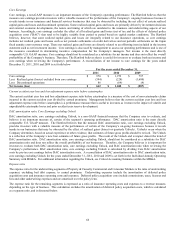
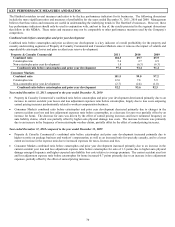
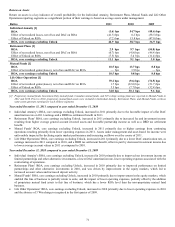
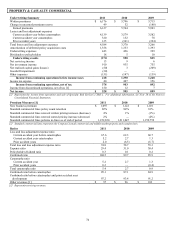
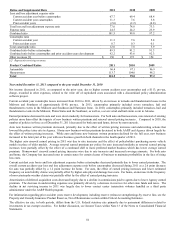
After-tax margin
After-tax margin is a key indicator of overall profitability for the Individual Life and Group Benefits reporting segments as a significant
portion of their earnings are a result of the net margin from losses incurred on earned premiums, fees and other considerations.
2011
2010
2009
Individual Life
After-tax margin
9.6%
17.9%
1.3%
Effect of net realized gains (losses), net of tax and DAC on after-tax margin
1.3%
1.3%
(6.6%)
Effect of Unlock on after-tax margin
(5.5%)
1.7%
(4.7%)
After-tax margin, core earnings excluding Unlock
13.8%
14.9%
12.6%
Group Benefits
After-tax margin (excluding buyouts)
2.0%
3.9%
4.2%
Effect of net realized gains (losses), net of tax on after-tax margin
0.1%
0.5%
(1.5%)
After-tax margin (excluding buyouts), excluding realized gains (losses)
1.9%
3.4%
5.7%
Year ended December 31, 2011 compared to year ended December 31, 2010
• Individual Life’ s after-tax margin, core earnings excluding Unlock, decrease was primarily due to increased benefits, losses and
expenses and increased mortality costs, partially offset by increased net investment income.
• The decrease in Group Benefits’ after-tax margin (excluding buyouts), excluding realized gains (losses), was primarily due to
higher mortality and morbidity driven by elevated incidence and lower claim terminations, and to a lesser extent, a decrease in fully
insured ongoing premiums, driven by lower sales over the past year, as well as from a challenging economic environment.
Year ended December 31, 2010 compared to year ended December 31, 2009
• Individual Life’ s after-tax margin, core earnings excluding Unlock, increase was primarily due to lower DAC amortization and net
realized capital gains in 2010 compared to net realized capital losses in 2009.
• Group Benefits’ after-tax margin (excluding buyouts), excluding realized gains (losses), decrease was primarily due to a higher loss
ratio from unfavorable morbidity driven by lower claim terminations on disability business.