The Hartford 2011 Annual Report Download - page 54
Download and view the complete annual report
Please find page 54 of the 2011 The Hartford annual report below. You can navigate through the pages in the report by either clicking on the pages listed below, or by using the keyword search tool below to find specific information within the annual report.-
 1
1 -
2
-
3
-
4
-
5
-
6
-
7
-
8
-
9
-
10
-
11
-
12
-
13
-
14
-
15
-
16
-
17
-
18
-
19
-
20
-
21
-
22
-
23
-
24
-
25
-
26
-
27
-
28
-
29
-
30
-
31
-
32
-
33
-
34
-
35
-
36
-
37
-
38
-
39
-
40
-
41
-
42
-
43
-
 44
44 -
 45
45 -
 46
46 -
 47
47 -
 48
48 -
 49
49 -
 50
50 -
 51
51 -
 52
52 -
 53
53 -
 54
54 -
 55
55 -
 56
56 -
 57
57 -
 58
58 -
 59
59 -
 60
60 -
 61
61 -
 62
62 -
 63
63 -
 64
64 -
65
-
66
-
67
-
68
-
69
-
70
-
71
-
72
-
73
-
74
-
75
-
76
-
77
-
78
-
79
-
80
-
81
-
82
-
83
-
84
-
85
-
86
-
87
-
88
-
89
-
90
-
91
-
92
-
93
-
94
-
95
-
96
-
97
-
98
-
99
-
100
-
101
-
102
-
103
-
104
-
105
-
106
-
107
-
108
-
109
-
110
-
111
-
112
-
113
-
114
-
115
-
116
-
117
-
118
-
119
-
120
-
121
-
122
-
123
-
124
-
125
-
126
-
127
-
128
-
129
-
130
-
131
-
132
-
133
-
134
-
135
-
136
-
137
-
138
-
139
-
140
-
141
-
142
-
143
-
144
-
145
-
146
-
147
-
148
-
149
-
150
-
151
-
152
-
153
-
154
-
155
-
156
-
157
-
158
-
159
-
160
-
161
-
162
-
163
-
164
-
165
-
166
-
167
-
168
-
169
-
170
-
171
-
172
-
173
-
174
-
175
-
176
-
177
-
178
-
179
-
180
-
181
-
182
-
183
-
184
-
185
-
186
-
187
-
188
-
189
-
190
-
191
-
192
-
193
-
194
-
195
-
196
-
197
-
198
-
199
-
200
-
201
-
202
-
203
-
204
-
205
-
206
-
207
-
208
-
209
-
210
-
211
-
212
-
213
-
214
-
215
-
216
-
217
-
218
-
219
-
220
-
221
-
222
-
223
-
224
-
225
-
226
-
227
-
228
-
229
-
230
-
231
-
232
-
233
-
234
-
235
-
236
-
237
-
238
-
239
-
240
-
241
-
242
-
243
-
244
-
245
-
246
-
247
-
248
 |
 |

54
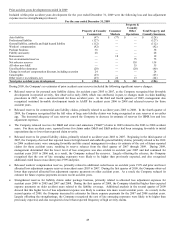
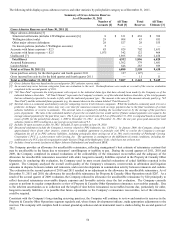
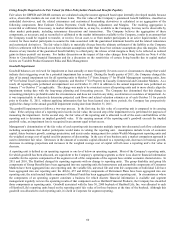
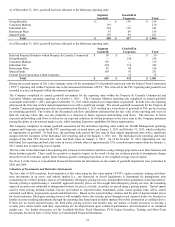
The following table displays gross asbestos reserves and other statistics by policyholder category as of December 31, 2011.
Summary of Gross Asbestos Reserves
As of December 31, 2011
Number of
Accounts [2]
All Time
Paid [3]
Total
Reserves
All Time
Ultimate [3]
Gross Asbestos Reserves as of June 30, 2011 [1]
Major asbestos defendants [5]
Structured settlements (includes 4 Wellington accounts) [6]
8
$
331
$
438
$
769
Wellington (direct only)
29
908
43
951
Other major asbestos defendants
28
527
28
555
No known policies (includes 3 Wellington accounts)
5
—
—
—
Accounts with future exposure > $2.5
85
929
702
1,631
Accounts with future exposure < $2.5
1,075
342
122
464
Unallocated [7]
1,895
563
2,458
Total Direct
4,932
1,896
6,828
Assumed Reinsurance
1,302
379
1,681
London Market
646
283
929
Total as of June 30, 2011 [1]
6,880
2,558
9,438
Gross paid loss activity for the third quarter and fourth quarter 2011
127
(127)
—
Gross incurred loss activity for the third quarter and fourth quarter 2011
—
11
11
Total as of December 31, 2011 [4]
$
7,007
$
2,442
$
9,449
[1] Gross Asbestos Reserves based on the second quarter 2011 asbestos reserve study.
[2] An account may move between categories from one evaluation to the next. Reclassifications were made as a result of the reserve evaluation
completed in the second quarter of 2011.
[3] "All Time Paid" represents the total payments with respect to the indicated claim type that have already been made by the Company as of the
indicated balance sheet date. "All Time Ultimate" represents the Company's estimate, as of the indicated balance sheet date, of the total payments
that are ultimately expected to be made to fully settle the indicated payment type. The amount is the sum of the amounts already paid (e.g. "All
Time Paid") and the estimated future payments (e.g. the amount shown in the column labeled "Total Reserves").
[4] Survival ratio is a commonly used industry ratio for comparing reserve levels between companies. While the method is commonly used, it is not a
predictive technique. Survival ratios may vary over time for numerous reasons such as large payments due to the final resolution of certain
asbestos liabilities, or reserve re-estimates. The survival ratio is computed by dividing the recorded reserves by the average of the past three
years of payments. The ratio is the calculated number of years the recorded reserves would survive if future annual payments were equal to the
average annual payments for the past three years. The 3-year gross survival ratio of 8.3 as of December 31, 2011 is computed based on total paid
losses of $881 for the period from January 1, 2009 to December 31, 2011. As of December 31, 2011, the one year gross paid amount for total
asbestos claims is $258 resulting in a one year gross survival ratio of 9.5.
[5] Includes 24 open accounts at June 30, 2011. Included 25 open accounts at June 30, 2010.
[6] Structured settlements include the Company’s reserves related to PPG Industries, Inc. (“PPG”). In January 2009, the Company, along with
approximately three dozen other insurers, entered into a modified agreement in principle with PPG to resolve the Company’s coverage
obligations for all of its PPG asbestos liabilities, including principally those arising out of its 50% stock ownership of Pittsburgh Corning
Corporation (“PCC”), a joint venture with Corning, Inc. The agreement is contingent on the fulfillment of certain conditions, including the
confirmation of a PCC plan of reorganization under Section 524(g) of the Bankruptcy Code, which have not yet been met.
[7] Includes closed accounts (exclusive of Major Asbestos Defendants) and unallocated IBNR.
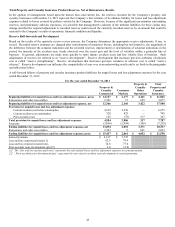
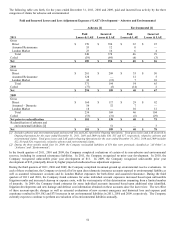
The Company provides an allowance for uncollectible reinsurance, reflecting management’ s best estimate of reinsurance cessions that
may be uncollectible in the future due to reinsurers’ unwillingness or inability to pay. During the second quarters of 2011, 2010 and
2009, the Company completed its annual evaluations of the collectability of the reinsurance recoverables and the adequacy of the
allowance for uncollectible reinsurance associated with older, long-term casualty liabilities reported in the Property & Casualty Other
Operations. In conducting this evaluation, the Company used its most recent detailed evaluations of ceded liabilities reported in the
segment. The Company analyzed the overall credit quality of the Company’ s reinsurers, recent trends in arbitration and litigation
outcomes in disputes between cedants and reinsurers, and recent developments in commutation activity between reinsurers and cedants.
The evaluation in the second quarters of 2010 and 2011 resulted in no adjustment to the allowance for uncollectible reinsurance. As of
December 31, 2011 and 2010, the allowance for uncollectible reinsurance for Property & Casualty Other Operations totals $207. As a
result of the second quarter of 2009 evaluation, the Company reduced its allowance for uncollectible reinsurance by $20 principally to
reflect decreased reinsurance recoverable dispute exposure and favorable activity since the last evaluation. The Company currently
expects to perform its regular comprehensive review of Property & Casualty Other Operations reinsurance recoverables annually. Due
to the inherent uncertainties as to collection and the length of time before reinsurance recoverables become due, particularly for older,
long-term casualty liabilities, it is possible that future adjustments to the Company’ s reinsurance recoverables, net of the allowance,
could be required.
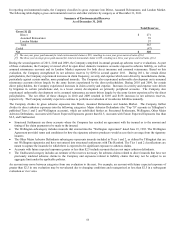
Consistent with the Company’ s long-standing reserving practices, the Company will continue to review and monitor its reserves in the
Property & Casualty Other Operations segment regularly and, where future developments indicate, make appropriate adjustments to the
reserves. The company will complete both its annual ground-up asbestos and environmental reserve studies during the second quarter of
2012.