The Hartford 2011 Annual Report Download - page 113
Download and view the complete annual report
Please find page 113 of the 2011 The Hartford annual report below. You can navigate through the pages in the report by either clicking on the pages listed below, or by using the keyword search tool below to find specific information within the annual report.-
 1
1 -
2
-
3
-
4
-
5
-
6
-
7
-
8
-
9
-
10
-
11
-
12
-
13
-
14
-
15
-
16
-
17
-
18
-
19
-
20
-
21
-
22
-
23
-
24
-
25
-
26
-
27
-
28
-
29
-
30
-
31
-
32
-
33
-
34
-
35
-
36
-
37
-
38
-
39
-
40
-
41
-
42
-
43
-
44
-
45
-
46
-
47
-
48
-
49
-
50
-
51
-
52
-
53
-
54
-
55
-
56
-
57
-
58
-
59
-
60
-
61
-
62
-
63
-
64
-
65
-
66
-
67
-
68
-
69
-
70
-
71
-
72
-
73
-
74
-
75
-
76
-
77
-
78
-
79
-
80
-
81
-
82
-
83
-
84
-
85
-
86
-
87
-
88
-
89
-
90
-
91
-
92
-
93
-
94
-
95
-
96
-
97
-
98
-
99
-
100
-
101
-
102
-
 103
103 -
 104
104 -
 105
105 -
 106
106 -
 107
107 -
 108
108 -
 109
109 -
 110
110 -
 111
111 -
 112
112 -
 113
113 -
 114
114 -
 115
115 -
 116
116 -
 117
117 -
 118
118 -
 119
119 -
 120
120 -
 121
121 -
 122
122 -
 123
123 -
124
-
125
-
126
-
127
-
128
-
129
-
130
-
131
-
132
-
133
-
134
-
135
-
136
-
137
-
138
-
139
-
140
-
141
-
142
-
143
-
144
-
145
-
146
-
147
-
148
-
149
-
150
-
151
-
152
-
153
-
154
-
155
-
156
-
157
-
158
-
159
-
160
-
161
-
162
-
163
-
164
-
165
-
166
-
167
-
168
-
169
-
170
-
171
-
172
-
173
-
174
-
175
-
176
-
177
-
178
-
179
-
180
-
181
-
182
-
183
-
184
-
185
-
186
-
187
-
188
-
189
-
190
-
191
-
192
-
193
-
194
-
195
-
196
-
197
-
198
-
199
-
200
-
201
-
202
-
203
-
204
-
205
-
206
-
207
-
208
-
209
-
210
-
211
-
212
-
213
-
214
-
215
-
216
-
217
-
218
-
219
-
220
-
221
-
222
-
223
-
224
-
225
-
226
-
227
-
228
-
229
-
230
-
231
-
232
-
233
-
234
-
235
-
236
-
237
-
238
-
239
-
240
-
241
-
242
-
243
-
244
-
245
-
246
-
247
-
248
 |
 |
113
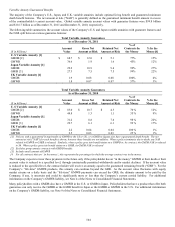
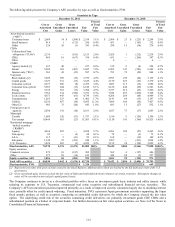
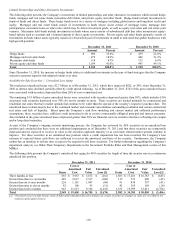
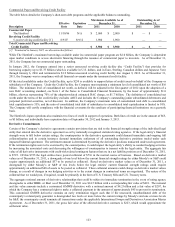
The following table presents the Company’ s AFS securities by type, as well as fixed maturities, FVO.
Securities by Type
December 31, 2011
December 31, 2010
Cost or
Amortized
Cost
Gross
Unrealized
Gains
Gross
Unrealized
Losses
Fair
Value
Percent
of Total
Fair
Value
Cost or
Amortized
Cost
Gross
Unrealized
Gains
Gross
Unrealized
Losses
Fair
Value
Percent
of Total
Fair
Value
Asset-backed securities
(“ABS”)
Consumer loans $ 2,688 34 $ (208)
$
2,514 3.1% $
2,496 $
23 $
(221) $
2,298 2.9%
Small business
418
1
(123)
296
0.4%
453
—
(141)
312
0.4%
Other
324
20
(1)
343
0.4%
298
15
(34)
279
0.4%
CDOs
Collateralized loan
obligations (“CLOs”) 2,334 — (181)
2,153 2.6% 2,429 1 (212) 2,218 2.9%
CREs
485
16
(167)
334
0.4%
653
—
(266)
387
0.5%
Other
—
—
—
—
—
6
—
—
6
—
CMBS
Agency backed [1]
637
40
—
677
0.8%
519
9
(4)
524
0.7%
Bonds
5,992
182
(487)
5,687
7.0%
6,985
147
(583)
6,549
8.4%
Interest only (“IOs”)
563
49
(25)
587
0.7%
793
79
(28)
844
1.1%
Corporate
Basic industry [2]
3,690
309
(19)
3,979
4.9%
2,993
190
(24)
3,159
4.1%
Capital goods 3,327 331 (33)
3,625 4.4% 3,179 223 (23) 3,379 4.3%
Consumer cyclical
2,277
206
(8)
2,475
3.0%
1,883
115
(12)
1,986
2.6%
Consumer non-cyclical
5,985
644
(13)
6,616
8.1%
6,126
444
(29)
6,541
8.4%
Energy
3,338
381
(15)
3,704
4.5%
3,377
212
(23)
3,566
4.6%
Financial services
7,763
334
(526)
7,571
9.3%
7,545
253
(470)
7,328
9.4%
Tech./comm.
4,357
443
(61)
4,739
5.8%
4,268
269
(68)
4,469
5.7%
Transportation 1,285 123 (6)
1,402 1.7% 1,141 69 (13) 1,197 1.5%
Utilities
8,236
857
(38)
9,055
11.2%
7,099
386
(58)
7,427
9.5%
Other [2]
903
33
(20)
845
1.0%
885
13
(27)
832
1.1%
Foreign govt./govt.
agencies
2,030
141
(10)
2,161
2.6%
1,627
73
(17)
1,683
2.2%
Municipal
Taxable
1,688
120
(51)
1,757
2.1%
1,319
9
(129)
1,199
1.5%
Tax-exempt
10,869
655
(21)
11,503
14.1%
11,150
141
(366)
10,925
14.0%
Residential mortgage-
backed securities
(“RMBS”)
Agency
4,436
222
—
4,658
5.7%
4,283
109
(27)
4,365
5.6%
Non-agency
62
—
(2)
60
0.1%
78
—
(3)
75
0.1%
Alt-A
115
5
(21)
99
0.1%
168
—
(19)
149
0.2%
Sub-prime 1,348 25 (433)
940 1.1% 1,507 — (413) 1,094 1.4%
U.S. Treasuries
3,828
203
(2)
4,029
4.9%
5,159
24
(154)
5,029
6.5%
Fixed maturities, AFS
78,978
5,374
(2,471)
81,809
100%
78,419
2,804
(3,364)
77,820
100.0%
Equity securities
Financial services
479
10
(187)
302
569
4
(127)
446
Other
577
58
(16)
619
444
88
(5)
527
Equity securities, AFS
1,056
68
(203)
921
1,013
92
(132)
973
Total AFS securities
$
80,034
5,442
$
(2,674)
$
82,730
$
79,432
$
2,896
$
(3,496)
$
78,793
Fixed maturities, FVO
$
1,328
$
649
[1] Represents securities with pools of loans issued by the Small Business Administration which are backed by the full faith and credit of the U.S.
government.
[2] Gross unrealized gains (losses) exclude the fair value of bifurcated embedded derivative features of certain securities. Subsequent changes in
value will be recorded in net realized capital gains (losses).
The Company continues to invest in a diversified portfolio with a focus on investment grade basic industry and utility issuers, while
reducing its exposure to U.S. Treasuries, commercial real estate securities and subordinated financial services securities. The
Company’ s AFS net unrealized position improved primarily as a result of improved security valuations largely due to declining interest
rates, partially offset by credit spread widening. Fixed maturities, FVO, represents Japan government securities supporting the Japan
fixed annuity product, as well as securities containing an embedded credit derivative for which the Company elected the fair value
option. The underlying credit risk of the securities containing credit derivatives are primarily investment grade CRE CDOs and a
subordinated position on a basket of corporate bonds. For further discussion on fair value option securities, see Note 4 of the Notes to
Consolidated Financial Statements.