The Hartford 2011 Annual Report Download - page 82
Download and view the complete annual report
Please find page 82 of the 2011 The Hartford annual report below. You can navigate through the pages in the report by either clicking on the pages listed below, or by using the keyword search tool below to find specific information within the annual report.-
 1
1 -
2
-
3
-
4
-
5
-
6
-
7
-
8
-
9
-
10
-
11
-
12
-
13
-
14
-
15
-
16
-
17
-
18
-
19
-
20
-
21
-
22
-
23
-
24
-
25
-
26
-
27
-
28
-
29
-
30
-
31
-
32
-
33
-
34
-
35
-
36
-
37
-
38
-
39
-
40
-
41
-
42
-
43
-
44
-
45
-
46
-
47
-
48
-
49
-
50
-
51
-
52
-
53
-
54
-
55
-
56
-
57
-
58
-
59
-
60
-
61
-
62
-
63
-
64
-
65
-
66
-
67
-
68
-
69
-
70
-
71
-
 72
72 -
 73
73 -
 74
74 -
 75
75 -
 76
76 -
 77
77 -
 78
78 -
 79
79 -
 80
80 -
 81
81 -
 82
82 -
 83
83 -
 84
84 -
 85
85 -
 86
86 -
 87
87 -
 88
88 -
 89
89 -
 90
90 -
 91
91 -
 92
92 -
93
-
94
-
95
-
96
-
97
-
98
-
99
-
100
-
101
-
102
-
103
-
104
-
105
-
106
-
107
-
108
-
109
-
110
-
111
-
112
-
113
-
114
-
115
-
116
-
117
-
118
-
119
-
120
-
121
-
122
-
123
-
124
-
125
-
126
-
127
-
128
-
129
-
130
-
131
-
132
-
133
-
134
-
135
-
136
-
137
-
138
-
139
-
140
-
141
-
142
-
143
-
144
-
145
-
146
-
147
-
148
-
149
-
150
-
151
-
152
-
153
-
154
-
155
-
156
-
157
-
158
-
159
-
160
-
161
-
162
-
163
-
164
-
165
-
166
-
167
-
168
-
169
-
170
-
171
-
172
-
173
-
174
-
175
-
176
-
177
-
178
-
179
-
180
-
181
-
182
-
183
-
184
-
185
-
186
-
187
-
188
-
189
-
190
-
191
-
192
-
193
-
194
-
195
-
196
-
197
-
198
-
199
-
200
-
201
-
202
-
203
-
204
-
205
-
206
-
207
-
208
-
209
-
210
-
211
-
212
-
213
-
214
-
215
-
216
-
217
-
218
-
219
-
220
-
221
-
222
-
223
-
224
-
225
-
226
-
227
-
228
-
229
-
230
-
231
-
232
-
233
-
234
-
235
-
236
-
237
-
238
-
239
-
240
-
241
-
242
-
243
-
244
-
245
-
246
-
247
-
248
 |
 |
82
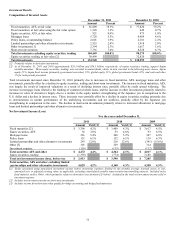
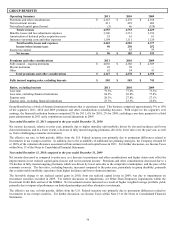
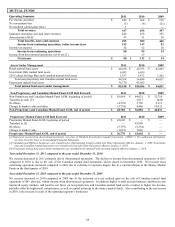
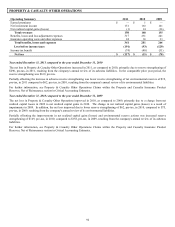
Year ended December 31, 2010 compared to the year ended December 31, 2009
Net income increased slightly in 2010, as compared to the prior year, despite a decrease in underwriting results. The primary causes of
the decrease in underwriting results were higher current accident year losses and loss adjustment expenses, including catastrophes,
partially offset by more favorable prior accident year reserve development. The lower underwriting results were offset by improvements
in net realized capital gains (losses) and higher net investment income.
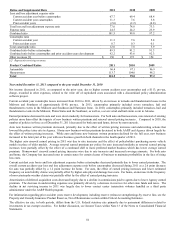
Current accident year losses and loss adjustment expenses before catastrophes increased primarily due to an increase in the current
accident year loss and loss adjustment expense ratio before catastrophes for auto due to higher auto physical damage emerged frequency
and higher expected auto liability loss costs relative to average premium. The current accident year loss and loss adjustment expense
ratio before catastrophes for home increased primarily due to an increase in loss adjustment expenses, partially offset by the effect of
earned pricing increases.
Current accident year catastrophes were higher in 2010 than in 2009 primarily due to a severe wind and hail storm event in Arizona
during the fourth quarter of 2010. Losses in 2010 were also incurred from tornadoes, thunderstorms and hail events in the Midwest,
plains states and the Southeast, as well as from winter storms in the Mid-Atlantic and Northeast. Catastrophe losses in 2009 were
primarily incurred from windstorms in Texas and the Midwest as well as the two large Colorado hail and windstorm events.
For information regarding prior accident years reserve development, including reserve (releases) strengthenings by reserve line, see the
Property and Casualty Insurance Product Reserves, Net of Reinsurance section within Critical Accounting Estimates.
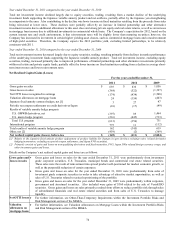
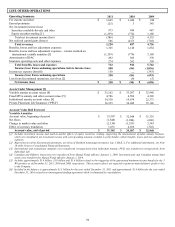
Earned premiums decreased in 2010, as lower earned premiums in auto were partially offset by an increase in homeowners. Auto
earned premiums were down reflecting a decrease in new business written premium and policy count retention since the fourth quarter
of 2009 and a decrease in average renewal earned premium per policy. Homeowners’ earned premiums grew primarily due to the effect
of increases in earned pricing, partially offset by a decrease in new business written premium and policy count retention.
Auto and home new business written premium decreased primarily due to the effect of written pricing increases and underwriting
actions that lowered the policy issue rate. Also contributing to the decrease in new business were fewer responses from direct marketing
on AARP business and fewer quotes from independent agents driven by increased competition. Partially offsetting the decrease in auto
new business was the effect of an increase in policies sold to AARP members through agents. Partially offsetting the decrease in home
new business was an increase in the cross-sale of homeowners’ insurance to insureds that have auto policies.
The change in auto renewal earned pricing was flat due to rate increases and the effect of policyholders purchasing newer vehicle
models in place of older models. Despite auto renewal earned pricing increasing, average renewal earned premium per policy for auto
declined due to a shift to more preferred market segments and a greater concentration of business in states and territories with lower
average premium. Homeowners’ renewal earned pricing increased due to rate increases and increased coverage amounts reflecting
higher rebuilding costs. For both auto and home, the Company has increased rates in certain states for certain classes of business to
maintain profitability in the face of rising loss costs.
Policy count retention for auto and home decreased primarily driven by the effect of renewal written pricing increases and underwriting
actions to improve profitability. The decrease in the policy count retention for homeowners was partially offset by the effect of the
Company’ s non-renewal of Florida homeowners’ agency business in 2009. Compared to 2009, the number of policies in-force as of
2010 decreased for both auto and home, driven by the decreases in policy retention and new business.
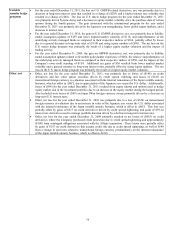
The expense ratio increased due largely to an increase in legal settlement costs in 2010 and higher amortization of acquisition costs on
AARP business, partially offset by lower direct marketing spend for consumer direct business. Also contributing to the increase in the
expense ratio was a reduction of TWIA hurricane assessments in 2009 largely offset by an increase in reserves for other state funds and
taxes in 2009.
Net realized capital gains (losses) improved, as compared to prior year. The improvements were primarily driven by lower impairments
in 2010 compared to 2009 and realized gains on derivatives in 2010 compared to losses in 2009. Net investment income increased,
primarily as a result of increased income from limited partnerships and other alternative investments, partially offset by lower returns on
taxable fixed maturities due to declining interest rates. For additional information, see the Investment Results section within Key
Performance Measures and Ratios.
The effective tax rate, in both periods, differs from the U.S. Federal statutory rate primarily due to permanent differences related to
investments in tax exempt securities. For further discussion, see Income Taxes within Note 13 of the Notes to Consolidated Financial
Statements.