The Hartford 2011 Annual Report Download - page 34
Download and view the complete annual report
Please find page 34 of the 2011 The Hartford annual report below. You can navigate through the pages in the report by either clicking on the pages listed below, or by using the keyword search tool below to find specific information within the annual report.-
 1
1 -
2
-
3
-
4
-
5
-
6
-
7
-
8
-
9
-
10
-
11
-
12
-
13
-
14
-
15
-
16
-
17
-
18
-
19
-
20
-
21
-
22
-
23
-
 24
24 -
 25
25 -
 26
26 -
 27
27 -
 28
28 -
 29
29 -
 30
30 -
 31
31 -
 32
32 -
 33
33 -
 34
34 -
 35
35 -
 36
36 -
 37
37 -
 38
38 -
 39
39 -
 40
40 -
 41
41 -
 42
42 -
 43
43 -
 44
44 -
45
-
46
-
47
-
48
-
49
-
50
-
51
-
52
-
53
-
54
-
55
-
56
-
57
-
58
-
59
-
60
-
61
-
62
-
63
-
64
-
65
-
66
-
67
-
68
-
69
-
70
-
71
-
72
-
73
-
74
-
75
-
76
-
77
-
78
-
79
-
80
-
81
-
82
-
83
-
84
-
85
-
86
-
87
-
88
-
89
-
90
-
91
-
92
-
93
-
94
-
95
-
96
-
97
-
98
-
99
-
100
-
101
-
102
-
103
-
104
-
105
-
106
-
107
-
108
-
109
-
110
-
111
-
112
-
113
-
114
-
115
-
116
-
117
-
118
-
119
-
120
-
121
-
122
-
123
-
124
-
125
-
126
-
127
-
128
-
129
-
130
-
131
-
132
-
133
-
134
-
135
-
136
-
137
-
138
-
139
-
140
-
141
-
142
-
143
-
144
-
145
-
146
-
147
-
148
-
149
-
150
-
151
-
152
-
153
-
154
-
155
-
156
-
157
-
158
-
159
-
160
-
161
-
162
-
163
-
164
-
165
-
166
-
167
-
168
-
169
-
170
-
171
-
172
-
173
-
174
-
175
-
176
-
177
-
178
-
179
-
180
-
181
-
182
-
183
-
184
-
185
-
186
-
187
-
188
-
189
-
190
-
191
-
192
-
193
-
194
-
195
-
196
-
197
-
198
-
199
-
200
-
201
-
202
-
203
-
204
-
205
-
206
-
207
-
208
-
209
-
210
-
211
-
212
-
213
-
214
-
215
-
216
-
217
-
218
-
219
-
220
-
221
-
222
-
223
-
224
-
225
-
226
-
227
-
228
-
229
-
230
-
231
-
232
-
233
-
234
-
235
-
236
-
237
-
238
-
239
-
240
-
241
-
242
-
243
-
244
-
245
-
246
-
247
-
248
 |
 |

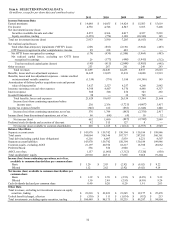
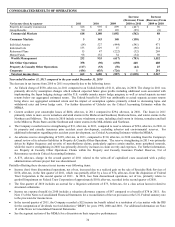
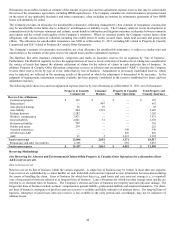
34
CONSOLIDATED RESULTS OF OPERATIONS
Net income (loss) by segment
2011
2010
2009
Increase
(Decrease) From
2010 to 2011
Increase
(Decrease) From
2009 to 2010
Property & Casualty Commercial
$
528
$
995
$
899
$
(467)
$
96
Group Benefits
90
185
193
(95)
(8)
Commercial Markets
618
1,180
1,092
(562)
88
Consumer Markets
5
143
140
(138)
3
Individual Annuity
(14)
527 (444)
(541)
971
Individual Life
133
229
15
(96)
214
Retirement Plans
15
47
(222)
(32)
269
Mutual Funds
98
132
34
(34)
98
Wealth Management
232
935
(617)
(703)
1,552
Life Other Operations
358
(90)
(698)
448
608
Property & Casualty Other Operations
(117)
(53)
(78)
(64)
25
Corporate
(434)
(435)
(726)
1
291
Total net income (loss)
$
662
$
1,680
$
(887)
$
(1,018)
$
2,567
Year ended December 31, 2011 compared to the year ended December 31, 2010
The decrease in net income from 2010 to 2011 was primarily due to the following items:
• An Unlock charge of $530, after-tax, in 2011 compared to an Unlock benefit of $111, after-tax, in 2010. The charge in 2011 was
primarily driven by assumption changes which reduced expected future gross profits including additional costs associated with
implementing the Japan hedging strategy and the U.S. variable annuity macro hedge program, as well as actual separate account
returns below our aggregated estimated return. The Unlock benefit for 2010 was attributable to actual separate account returns
being above our aggregated estimated return and the impact of assumption updates primarily related to decreasing lapse and
withdrawal rates and lower hedge costs. For further discussion of Unlocks see the Critical Accounting Estimates within the
MD&A.
• Current accident year catastrophe losses of $484, after-tax, in 2011 compared to $294, after-tax, in 2010. The losses in 2011
primarily relate to more severe tornadoes and wind storms in the Midwest and Southeast, Hurricane Irene, and winter storms in the
Northeast and Midwest. The losses in 2010 include severe windstorm events, including a hail storm in Arizona, tornadoes and hail
in the Midwest, Plains States and the Southeast and winter storms in the Mid-Atlantic and Northeast.
• The Company recorded reserve strengthening of $31, after-tax, in 2011, compared to reserve releases of $294, after-tax, in 2010, in
its property and casualty insurance prior accident years development, excluding asbestos and environmental reserves. For
additional information regarding prior accident years development, see Critical Accounting Estimates within the MD&A.
• An asbestos reserve strengthening of $189, after-tax, in 2011, compared to $110, after-tax, in 2010 resulting from the Company's
annual review of its asbestos liabilities in Property & Casualty Other Operations. The reserve strengthening in 2011 was primarily
driven by higher frequency and severity of mesothelioma claims, particularly against certain smaller, more peripheral insureds,
while the reserve strengthening in 2010 was primarily driven by increases in claim severity and expenses. For further information,
see Property & Casualty Other Operations Claims within the Property and Casualty Insurance Product Reserves, Net of
Reinsurance section in Critical Accounting Estimates.
• A $73, after-tax, charge in the second quarter of 2011 related to the write-off of capitalized costs associated with a policy
administration software project that was discontinued.
Partially offsetting these decreases in net income were following items:
• Income (loss) from discontinued operations, net of tax, increased due to a realized gain on the sale of Specialty Risk Services of
$150, after-tax, in the first quarter of 2011, which was partially offset by a loss of $74, after-tax, from the disposition of Federal
Trust Corporation in the second quarter of 2011. In 2010, loss from discontinued operations, net of tax, primarily relates to
goodwill impairment on Federal Trust Corporation of approximately $100, after-tax, recorded in the second quarter of 2010.
• The first quarter of 2010 includes an accrual for a litigation settlement of $73, before-tax, for a class action lawsuit related to
structured settlements.
• Income tax expense (benefit) in 2010 includes a valuation allowance expense of $87 compared to a benefit of $78 in 2011. See
Note 13 of the Notes to Consolidated Financial Statements for a reconciliation of the tax provision at the U.S. Federal statutory rate
to the provision for income taxes.
• In the second quarter of 2011, the Company recorded a $52 income tax benefit related to a resolution of a tax matter with the IRS
for the computation of dividends received deduction (“DRD”) for years 1998, 2000 and 2001. For additional information see Note
13 of the Notes to Consolidated Financial Statements.
• See the segment sections of the MD&A for a discussion on their respective performances.