The Hartford 2011 Annual Report Download - page 128
Download and view the complete annual report
Please find page 128 of the 2011 The Hartford annual report below. You can navigate through the pages in the report by either clicking on the pages listed below, or by using the keyword search tool below to find specific information within the annual report.-
 1
1 -
2
-
3
-
4
-
5
-
6
-
7
-
8
-
9
-
10
-
11
-
12
-
13
-
14
-
15
-
16
-
17
-
18
-
19
-
20
-
21
-
22
-
23
-
24
-
25
-
26
-
27
-
28
-
29
-
30
-
31
-
32
-
33
-
34
-
35
-
36
-
37
-
38
-
39
-
40
-
41
-
42
-
43
-
44
-
45
-
46
-
47
-
48
-
49
-
50
-
51
-
52
-
53
-
54
-
55
-
56
-
57
-
58
-
59
-
60
-
61
-
62
-
63
-
64
-
65
-
66
-
67
-
68
-
69
-
70
-
71
-
72
-
73
-
74
-
75
-
76
-
77
-
78
-
79
-
80
-
81
-
82
-
83
-
84
-
85
-
86
-
87
-
88
-
89
-
90
-
91
-
92
-
93
-
94
-
95
-
96
-
97
-
98
-
99
-
100
-
101
-
102
-
103
-
104
-
105
-
106
-
107
-
108
-
109
-
110
-
111
-
112
-
113
-
114
-
115
-
116
-
117
-
 118
118 -
 119
119 -
 120
120 -
 121
121 -
 122
122 -
 123
123 -
 124
124 -
 125
125 -
 126
126 -
 127
127 -
 128
128 -
 129
129 -
 130
130 -
 131
131 -
 132
132 -
 133
133 -
 134
134 -
 135
135 -
 136
136 -
 137
137 -
 138
138 -
139
-
140
-
141
-
142
-
143
-
144
-
145
-
146
-
147
-
148
-
149
-
150
-
151
-
152
-
153
-
154
-
155
-
156
-
157
-
158
-
159
-
160
-
161
-
162
-
163
-
164
-
165
-
166
-
167
-
168
-
169
-
170
-
171
-
172
-
173
-
174
-
175
-
176
-
177
-
178
-
179
-
180
-
181
-
182
-
183
-
184
-
185
-
186
-
187
-
188
-
189
-
190
-
191
-
192
-
193
-
194
-
195
-
196
-
197
-
198
-
199
-
200
-
201
-
202
-
203
-
204
-
205
-
206
-
207
-
208
-
209
-
210
-
211
-
212
-
213
-
214
-
215
-
216
-
217
-
218
-
219
-
220
-
221
-
222
-
223
-
224
-
225
-
226
-
227
-
228
-
229
-
230
-
231
-
232
-
233
-
234
-
235
-
236
-
237
-
238
-
239
-
240
-
241
-
242
-
243
-
244
-
245
-
246
-
247
-
248
 |
 |

128
Equity Markets
For a discussion of the potential impact of the equity markets on capital and liquidity, see the Financial Risk on Statutory Capital and
Liquidity Risk section in this MD&A.
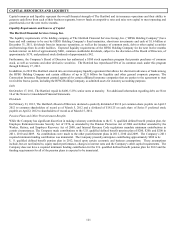
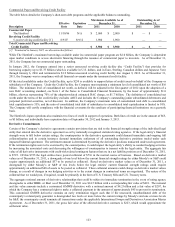
Ratings
Ratings impact the Company’ s cost of borrowing and its ability to access financing and are an important factor in establishing
competitive position in the insurance and financial services marketplace. There can be no assurance that the Company’ s ratings will
continue for any given period of time or that they will not be changed. In the event the Company's ratings are downgraded, the
Company’ s cost of borrowing and ability to access financing, as well as the level of revenues or the persistency of its business may be
adversely impacted.
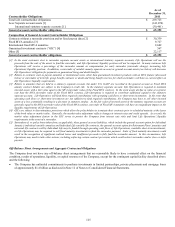
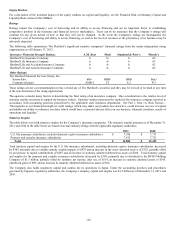
The following table summarizes The Hartford’ s significant member companies’ financial ratings from the major independent rating
organizations as of February 17, 2012.
Insurance Financial Strength Ratings:
A.M. Best
Fitch
Standard & Poor’s
Moody’s
Hartford Fire Insurance Company
A
A+
A
A2
Hartford Life Insurance Company
A
A-
A
A3
Hartford Life and Accident Insurance Company
A
A-
A
A3
Hartford Life and Annuity Insurance Company
A
A-
A
A3
Other Ratings:
The Hartford Financial Services Group, Inc.:
Senior debt
Commercial paper
bbb+
AMB-2
BBB-
F2
BBB
A-2
Baa3
P-3
These ratings are not a recommendation to buy or hold any of The Hartford’ s securities and they may be revised or revoked at any time
at the sole discretion of the rating organization.
The agencies consider many factors in determining the final rating of an insurance company. One consideration is the relative level of
statutory surplus necessary to support the business written. Statutory surplus represents the capital of the insurance company reported in
accordance with accounting practices prescribed by the applicable state insurance department. See Part I, Item 1A. Risk Factors –
“Downgrades in our financial strength or credit ratings, which may make our products less attractive, could increase our cost of capital
and inhibit our ability to refinance our debt, which would have a material adverse effect on our business, financial condition, results of
operations and liquidity.”
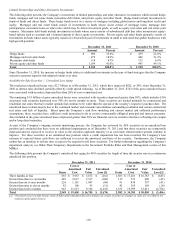
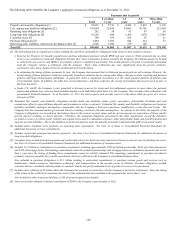
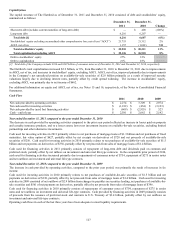
Statutory Surplus
The table below sets forth statutory surplus for the Company’ s insurance companies. The statutory surplus amounts as of December 31,
2011 and 2010 in the table below are based on actual statutory filings with the applicable regulatory authorities.
2011
2010
U.S. life insurance subsidiaries, includes domestic captive insurance subsidiaries
$
7,388
$
7,731
Property and casualty insurance subsidiaries
7,412
7,721
Total
$
14,800
$
15,452
Total statutory capital and surplus for the U.S. life insurance subsidiaries, including domestic captive insurance subsidiaries, decreased
by $343, primarily due to variable annuity surplus impacts of $470 and an increase in the asset valuation reserve of $323, partially offset
by an increase in capital contributions of $287 and an increase in statutory admitted deferred tax assets of $268. Total statutory capital
and surplus for the property and casualty insurance subsidiaries decreased by $309, primarily due to dividends to the HFSG Holding
Company of $1.1 billion, partially offset by statutory net income, after tax, of $514, an increase in statutory admitted assets of $145,
unrealized gains of $90, and an increase in statutory admitted deferred tax assets of $26.
The Company also holds regulatory capital and surplus for its operations in Japan. Under the accounting practices and procedures
governed by Japanese regulatory authorities, the Company’ s statutory capital and surplus was $1.3 billion as of December 31, 2011 and
2010.