The Hartford 2011 Annual Report Download - page 162
Download and view the complete annual report
Please find page 162 of the 2011 The Hartford annual report below. You can navigate through the pages in the report by either clicking on the pages listed below, or by using the keyword search tool below to find specific information within the annual report.-
 1
1 -
2
-
3
-
4
-
5
-
6
-
7
-
8
-
9
-
10
-
11
-
12
-
13
-
14
-
15
-
16
-
17
-
18
-
19
-
20
-
21
-
22
-
23
-
24
-
25
-
26
-
27
-
28
-
29
-
30
-
31
-
32
-
33
-
34
-
35
-
36
-
37
-
38
-
39
-
40
-
41
-
42
-
43
-
44
-
45
-
46
-
47
-
48
-
49
-
50
-
51
-
52
-
53
-
54
-
55
-
56
-
57
-
58
-
59
-
60
-
61
-
62
-
63
-
64
-
65
-
66
-
67
-
68
-
69
-
70
-
71
-
72
-
73
-
74
-
75
-
76
-
77
-
78
-
79
-
80
-
81
-
82
-
83
-
84
-
85
-
86
-
87
-
88
-
89
-
90
-
91
-
92
-
93
-
94
-
95
-
96
-
97
-
98
-
99
-
100
-
101
-
102
-
103
-
104
-
105
-
106
-
107
-
108
-
109
-
110
-
111
-
112
-
113
-
114
-
115
-
116
-
117
-
118
-
119
-
120
-
121
-
122
-
123
-
124
-
125
-
126
-
127
-
128
-
129
-
130
-
131
-
132
-
133
-
134
-
135
-
136
-
137
-
138
-
139
-
140
-
141
-
142
-
143
-
144
-
145
-
146
-
147
-
148
-
149
-
150
-
151
-
 152
152 -
 153
153 -
 154
154 -
 155
155 -
 156
156 -
 157
157 -
 158
158 -
 159
159 -
 160
160 -
 161
161 -
 162
162 -
 163
163 -
 164
164 -
 165
165 -
 166
166 -
 167
167 -
 168
168 -
 169
169 -
 170
170 -
 171
171 -
 172
172 -
173
-
174
-
175
-
176
-
177
-
178
-
179
-
180
-
181
-
182
-
183
-
184
-
185
-
186
-
187
-
188
-
189
-
190
-
191
-
192
-
193
-
194
-
195
-
196
-
197
-
198
-
199
-
200
-
201
-
202
-
203
-
204
-
205
-
206
-
207
-
208
-
209
-
210
-
211
-
212
-
213
-
214
-
215
-
216
-
217
-
218
-
219
-
220
-
221
-
222
-
223
-
224
-
225
-
226
-
227
-
228
-
229
-
230
-
231
-
232
-
233
-
234
-
235
-
236
-
237
-
238
-
239
-
240
-
241
-
242
-
243
-
244
-
245
-
246
-
247
-
248
 |
 |

THE HARTFORD FINANCIAL SERVICES GROUP, INC.
NOTES TO CONSOLIDATED FINANCIAL STATEMENTS (continued)
F-27
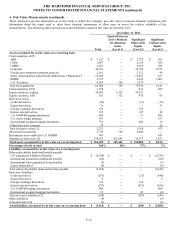
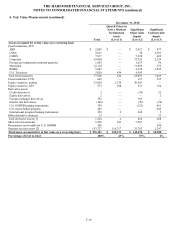
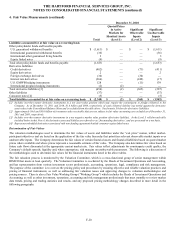
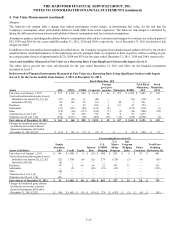
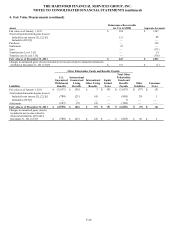
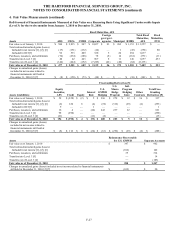
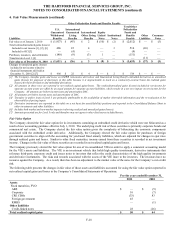
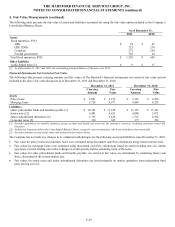
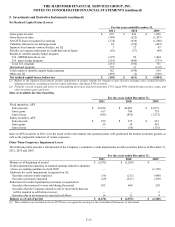
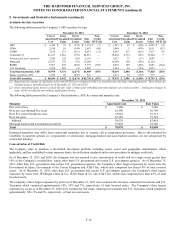
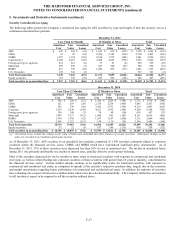
4. Fair Value Measurements (continued)
Roll-forward of Financial Instruments Measured at Fair Value on a Recurring Basis Using Significant Unobservable Inputs
(Level 3) for the twelve months from January 1, 2010 to December 31, 2010.
Fixed Maturities, AFS
Assets
ABS
CDOs
CMBS
Corporate
Foreign
govt./govt.
agencies
Municipal
RMBS
Total Fixed
Maturities,
AFS
Fixed
Maturities,
FVO
Fair value as of January 1, 2010
$
580
$
2,835
$
307
$
8,027
$
93
$
262
$
1,153
$
13,257
$
—
Total realized/unrealized gains (losses)
Included in net income [1], [2], [6]
(17)
(151)
(132)
(14)
—
1
(43)
(356)
80
Included in OCI [3]
92
533
409
320
5
24
254
1,637
—
Purchases, issuances, and settlements
(74)
(234)
(186)
78
(8)
14
(161)
(571)
(11)
Transfers into Level 3 [4]
40
42
443
967
8
11
146
1,657
453
Transfers out of Level 3 [4]
(144)
(444)
(152)
(7,249)
(42)
(40)
(64)
(8,135)
—
Fair value as of December 31, 2010
$
477
$
2,581
$
689
$
2,129
$
56
$
272
$
1,285
$
7,489
$
522
Changes in unrealized gains (losses)
included in net income related to
financial instruments still held at
December 31, 2010 [2] [7]
$
(8)
$
(158)
$
(73)
$
(24)
$
—
$
—
$
(38)
$
(301)
$
76
Freestanding Derivatives [5]
Assets (Liabilities)
Equity
Securities,
AFS
Credit
Equity
Interest
Rate
U.S.
GMWB
Hedging
U.S.
Macro
Hedge
Program
Intl.
Program
Hedging
Instr.
Other
Contracts
Total Free-
Standing
Derivatives [5]
Fair value as of January 1, 2010
$
58
$
(228)
$
(2)
$
5
$
236
$
278
$
12
$
36
$
337
Total realized/unrealized gains (losses)
Included in net income [1], [2], [6]
(6)
124
6
(4)
(74)
(312)
(29)
(4)
(293)
Included in OCI [3]
9
—
—
1
—
—
—
—
1
Purchases, issuances, and settlements
16
4
—
(44)
442
237
22
—
661
Transfers into Level 3 [4]
98
(290)
—
—
—
—
—
—
(290)
Transfers out of Level 3 [4]
(21)
—
—
(11)
(4)
—
—
—
(15)
Fair value as of December 31, 2010
$
154
$
(390)
$
4
$
(53)
$
600
$
203
$
5
$
32
$
401
Changes in unrealized gains (losses)
included in net income related to
financial instruments still held at
December 31, 2010 [2] [7] $
(8) $
116 $
6 $
(24) $
(61) $
(292) $
(29) $
(4) $
(288)
Assets
Reinsurance Recoverable
for U.S. GMWB
Separate Accounts
Fair value as of January 1, 2010
$
347
$
962
Total realized/unrealized gains (losses)
Included in net income [1], [2], [6] (102)
142
Purchases, issuances, and settlements
35
314
Transfers into Level 3 [4]
—
14
Transfers out of Level 3 [4]
—
(185)
Fair value as of December 31, 2010
$
280
$
1,247
Changes in unrealized gains (losses) included in net income related to financial instruments
still held at December 31, 2010 [2] [7]
$
(102)
$
20