The Hartford 2011 Annual Report Download - page 56
Download and view the complete annual report
Please find page 56 of the 2011 The Hartford annual report below. You can navigate through the pages in the report by either clicking on the pages listed below, or by using the keyword search tool below to find specific information within the annual report.-
 1
1 -
2
-
3
-
4
-
5
-
6
-
7
-
8
-
9
-
10
-
11
-
12
-
13
-
14
-
15
-
16
-
17
-
18
-
19
-
20
-
21
-
22
-
23
-
24
-
25
-
26
-
27
-
28
-
29
-
30
-
31
-
32
-
33
-
34
-
35
-
36
-
37
-
38
-
39
-
40
-
41
-
42
-
43
-
44
-
45
-
 46
46 -
 47
47 -
 48
48 -
 49
49 -
 50
50 -
 51
51 -
 52
52 -
 53
53 -
 54
54 -
 55
55 -
 56
56 -
 57
57 -
 58
58 -
 59
59 -
 60
60 -
 61
61 -
 62
62 -
 63
63 -
 64
64 -
 65
65 -
 66
66 -
67
-
68
-
69
-
70
-
71
-
72
-
73
-
74
-
75
-
76
-
77
-
78
-
79
-
80
-
81
-
82
-
83
-
84
-
85
-
86
-
87
-
88
-
89
-
90
-
91
-
92
-
93
-
94
-
95
-
96
-
97
-
98
-
99
-
100
-
101
-
102
-
103
-
104
-
105
-
106
-
107
-
108
-
109
-
110
-
111
-
112
-
113
-
114
-
115
-
116
-
117
-
118
-
119
-
120
-
121
-
122
-
123
-
124
-
125
-
126
-
127
-
128
-
129
-
130
-
131
-
132
-
133
-
134
-
135
-
136
-
137
-
138
-
139
-
140
-
141
-
142
-
143
-
144
-
145
-
146
-
147
-
148
-
149
-
150
-
151
-
152
-
153
-
154
-
155
-
156
-
157
-
158
-
159
-
160
-
161
-
162
-
163
-
164
-
165
-
166
-
167
-
168
-
169
-
170
-
171
-
172
-
173
-
174
-
175
-
176
-
177
-
178
-
179
-
180
-
181
-
182
-
183
-
184
-
185
-
186
-
187
-
188
-
189
-
190
-
191
-
192
-
193
-
194
-
195
-
196
-
197
-
198
-
199
-
200
-
201
-
202
-
203
-
204
-
205
-
206
-
207
-
208
-
209
-
210
-
211
-
212
-
213
-
214
-
215
-
216
-
217
-
218
-
219
-
220
-
221
-
222
-
223
-
224
-
225
-
226
-
227
-
228
-
229
-
230
-
231
-
232
-
233
-
234
-
235
-
236
-
237
-
238
-
239
-
240
-
241
-
242
-
243
-
244
-
245
-
246
-
247
-
248
 |
 |

56
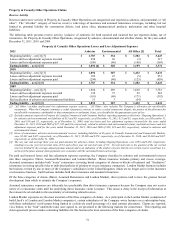
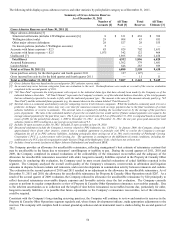
The table above shows the cumulative deficiency (redundancy) of the Company’ s reserves, net of reinsurance, as now estimated with the
benefit of additional information. Those amounts are comprised of changes in estimates of gross losses and changes in estimates of
related reinsurance recoveries.
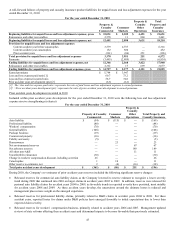
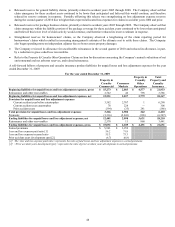
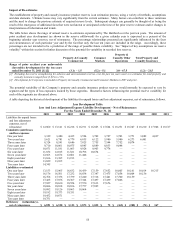
The table below, for the periods presented, reconciles the net reserves to the gross reserves, as initially estimated and recorded, and as
currently estimated and recorded, and computes the cumulative deficiency (redundancy) of the Company’ s reserves before reinsurance.
Loss And Loss Adjustment Expense Liability Development - Gross
For the Years Ended December 31,
2002 2003 2004 2005 2006 2007 2008 2009 2010 2011
Net reserve, as initially estimated
$
13,141
$
16,218
$
16,191
$
16,863
$
17,604
$
18,231
$
18,347
$
18,210
$
17,948
$
18,517
Reinsurance and other recoverables, as
initially estimated 3,950 5,497 5,138 5,403 4,387 3,922 3,586 3,441 3,077 3,033
Gross reserve, as initially estimated
$
17,091
$
21,715
$
21,329
$
22,266
$
21,991
$
22,153
$
21,933
$
21,651
$
21,025
$
21,550
Net re-estimated reserve
$
19,671
$
19,351
$
18,064
$
17,895
$
17,676
$
17,866
$
18,139
$
18,136
$
18,315
Re-estimated and other reinsurance
recoverables
5,693
5,592
5,469
5,792
4,193
3,910
3,585
3,064
2,799
Gross re-estimated reserve
$
25,364
$
24,943
$
23,533
$
23,687
$
21,869
$
21,776
$
21,724
$
21,200
$
21,114
Gross deficiency (redundancy)
$
8,273
$
3,228
$
2,204
$
1,421
$
(122)
$
(377)
$
(209)
$
(451)
$
89
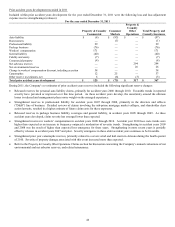
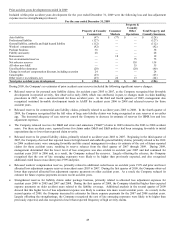
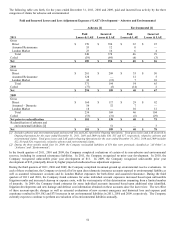
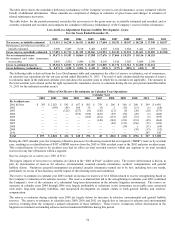
The following table is derived from the Loss Development table and summarizes the effect of reserve re-estimates, net of reinsurance,
on calendar year operations for the ten-year period ended December 31, 2011. The total of each column details the amount of reserve
re-estimates made in the indicated calendar year and shows the accident years to which the re-estimates are applicable. The amounts in
the total accident year column on the far right represent the cumulative reserve re-estimates during the ten year period ended December
31, 2011 for the indicated accident year(s).
Effect of Net Reserve Re-estimates on Calendar Year Operations
Calendar Year
2002
2003
2004
2005
2006
2007
2008
2009
2010
2011
Total
By Accident year
2001 & Prior
$
293
$
3,023
$
592
$
657
$
502
$
759
$
206
$
300
$
260
$
299
$
6,891
2002
—
(199)
(56)
180
36
(5)
2
(12)
(13)
(1)
(68)
2003
—
—
(122)
(237)
(31)
(126)
(21)
(6)
(20)
(10)
(573)
2004
—
—
—
(352)
(108)
(226)
(83)
(56)
(20)
(1)
(846)
2005
—
—
—
—
(103)
(214)
(133)
(47)
(91)
(5)
(593)
2006
—
—
—
—
—
(140)
(148)
(213)
(118)
(45)
(664)
2007
—
—
—
—
—
—
(49)
(113)
(156)
(71)
(389)
2008
—
—
—
—
—
—
—
(39)
1
(31)
(69)
2009
—
—
—
—
—
—
—
—
(39)
(13)
(52)
2010
—
—
—
—
—
—
—
—
—
245
245
Total
$
293
$
2,824
$
414
$
248
$
296
$
48
$
(226)
$
(186)
$
(196)
$
367
$
3,882
During the 2007 calendar year, the Company refined its processes for allocating incurred but not reported (“IBNR”) reserves by accident
year, resulting in a reclassification of $347 of IBNR reserves from the 2003 to 2006 accident years to the 2002 and prior accident years.
This reclassification of reserves by accident year had no effect on total recorded reserves within any segment or on total recorded
reserves for any line of business within a segment.
Reserve changes for accident years 2001 & Prior
The largest impacts of net reserve re-estimates are shown in the “2001 & Prior” accident years. The reserve deterioration is driven, in
part, by deterioration of reserves for asbestos, environmental, assumed casualty reinsurance, workers’ compensation, and general
liability claims. Numerous actuarial assumptions on assumed casualty reinsurance turned out to be low, including loss cost trends,
particularly on excess of loss business, and the impact of deteriorating terms and conditions.
The reserve re-estimates in calendar year 2003 include an increase in reserves of $2.6 billion related to reserve strengthening based on
the Company’ s evaluation of its asbestos reserves. The reserve evaluation that led to the strengthening in calendar year 2003 confirmed
the Company’ s view of the existence of a substantial long-term deterioration in the asbestos litigation environment. The reserve re-
estimates in calendar years 2004 through 2006 were largely attributable to reductions in the reinsurance recoverable asset associated
with older, long-term casualty liabilities, and unexpected development on mature claims in both general liability and workers’
compensation.
The reserve re-estimates during calendar year 2008 are largely driven by increases in asbestos, environmental and general liability
reserves. The reserve re-estimates in calendar years 2009, 2010 and 2011 are largely due to increases in asbestos and environmental
reserves, resulting from the Company’ s annual evaluations of these liabilities. These reserve evaluations reflect deterioration in the
litigation environment surrounding asbestos and environmental liabilities during this period.