The Hartford 2011 Annual Report Download - page 216
Download and view the complete annual report
Please find page 216 of the 2011 The Hartford annual report below. You can navigate through the pages in the report by either clicking on the pages listed below, or by using the keyword search tool below to find specific information within the annual report.-
 1
1 -
2
-
3
-
4
-
5
-
6
-
7
-
8
-
9
-
10
-
11
-
12
-
13
-
14
-
15
-
16
-
17
-
18
-
19
-
20
-
21
-
22
-
23
-
24
-
25
-
26
-
27
-
28
-
29
-
30
-
31
-
32
-
33
-
34
-
35
-
36
-
37
-
38
-
39
-
40
-
41
-
42
-
43
-
44
-
45
-
46
-
47
-
48
-
49
-
50
-
51
-
52
-
53
-
54
-
55
-
56
-
57
-
58
-
59
-
60
-
61
-
62
-
63
-
64
-
65
-
66
-
67
-
68
-
69
-
70
-
71
-
72
-
73
-
74
-
75
-
76
-
77
-
78
-
79
-
80
-
81
-
82
-
83
-
84
-
85
-
86
-
87
-
88
-
89
-
90
-
91
-
92
-
93
-
94
-
95
-
96
-
97
-
98
-
99
-
100
-
101
-
102
-
103
-
104
-
105
-
106
-
107
-
108
-
109
-
110
-
111
-
112
-
113
-
114
-
115
-
116
-
117
-
118
-
119
-
120
-
121
-
122
-
123
-
124
-
125
-
126
-
127
-
128
-
129
-
130
-
131
-
132
-
133
-
134
-
135
-
136
-
137
-
138
-
139
-
140
-
141
-
142
-
143
-
144
-
145
-
146
-
147
-
148
-
149
-
150
-
151
-
152
-
153
-
154
-
155
-
156
-
157
-
158
-
159
-
160
-
161
-
162
-
163
-
164
-
165
-
166
-
167
-
168
-
169
-
170
-
171
-
172
-
173
-
174
-
175
-
176
-
177
-
178
-
179
-
180
-
181
-
182
-
183
-
184
-
185
-
186
-
187
-
188
-
189
-
190
-
191
-
192
-
193
-
194
-
195
-
196
-
197
-
198
-
199
-
200
-
201
-
202
-
203
-
204
-
205
-
 206
206 -
 207
207 -
 208
208 -
 209
209 -
 210
210 -
 211
211 -
 212
212 -
 213
213 -
 214
214 -
 215
215 -
 216
216 -
 217
217 -
 218
218 -
 219
219 -
 220
220 -
 221
221 -
 222
222 -
 223
223 -
 224
224 -
 225
225 -
 226
226 -
227
-
228
-
229
-
230
-
231
-
232
-
233
-
234
-
235
-
236
-
237
-
238
-
239
-
240
-
241
-
242
-
243
-
244
-
245
-
246
-
247
-
248
 |
 |

THE HARTFORD FINANCIAL SERVICES GROUP, INC.
NOTES TO CONSOLIDATED FINANCIAL STATEMENTS (continued)
F-81
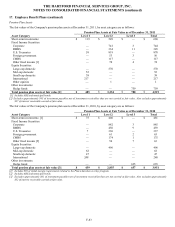
17. Employee Benefit Plans (continued)
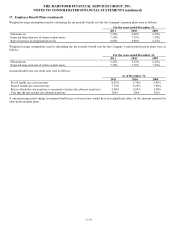
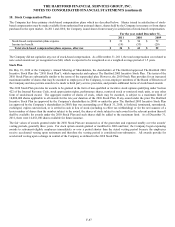
The fair value of assets for pension benefits, and hence the funded status, presented in the table above exclude assets of $109 and $107
held in rabbi trusts and designated for the non-qualified pension plans as of December 31, 2011 and 2010, respectively. The assets do
not qualify as plan assets; however, the assets are available to pay benefits for certain retired, terminated and active participants. Such
assets are available to the Company’ s general creditors in the event of insolvency. The assets consist of equity and fixed income
investments. To the extent the fair value of these rabbi trusts were included in the table above, pension plan assets would have been
$4,622 and $4,029 as of December 31, 2011 and 2010, respectively, and the funded status of pension benefits would have been $(843)
and $(766) as of December 31, 2011 and 2010, respectively.
The accumulated benefit obligation for all defined benefit pension plans was $5,413 and $4,753 as of December 31, 2011 and 2010,
respectively.
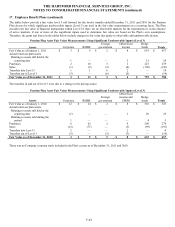
The following table provides information for The Hartford’ s defined benefit pension plans with an accumulated benefit obligation in
excess of plan assets as of December 31, 2011 and 2010.
December 31,
2011
2010
Projected benefit obligation
$
5,441
$
4,771
Accumulated benefit obligation
5,394
4,733
Fair value of plan assets
4,492
3,901
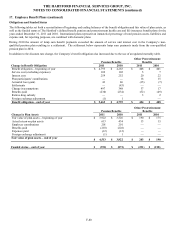
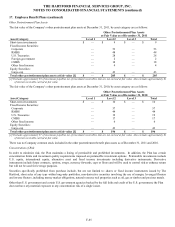
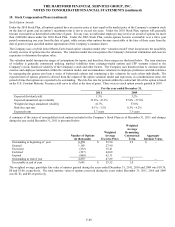
Amounts recognized in the Consolidated Balance Sheets consist of:
Pension Benefits
Other Postretirement Benefits
2011
2010
2011
2010
Other Assets
Noncurrent assets
$
—
$
—
$
—
$
—
Other Liabilities
Current liabilities
21
19
34
34
Noncurrent liabilities
931
854
187
184
Total
$
952
$
873
$
221
$
218
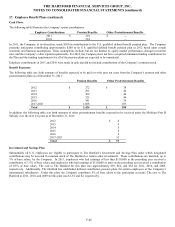
Components of Net Periodic Benefit Cost and Other Amounts Recognized in Other Comprehensive Income (Loss)
In the Company’ s non-qualified pension plan the amount of lump sum benefit payments exceeded the amount of service and interest
cost for the year ended December 31, 2010. As a result, the Company recorded settlement expense of $20 to recognize the actuarial loss
associated with the pro-rata portion of the obligation that has been settled.
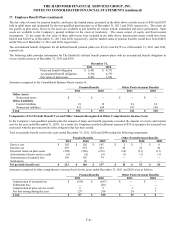
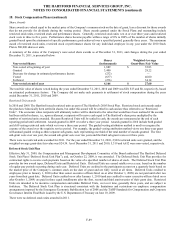
Total net periodic benefit cost for the years ended December 31, 2011, 2010 and 2009 include the following components:
Pension Benefits
Other Postretirement Benefits
2011
2010
2009
2011
2010
2009
Service cost
$
102
$
102
$
105
$
5
$
7
$
6
Interest cost
259
252
243
20
22
24
Expected return on plan assets
(298)
(286)
(276)
(14)
(13)
(11)
Amortization of prior service credit
(9)
(9)
(9)
(1)
(1)
(1)
Amortization of actuarial loss
159
107
74
—
—
—
Settlements
—
20
—
—
—
—
Net periodic benefit cost
$
213
$
186
$
137
$
10
$
15
$
18
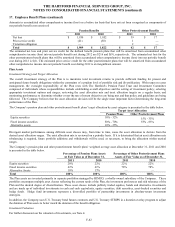
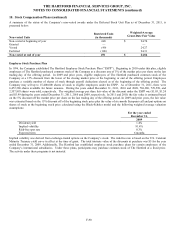
Amounts recognized in other comprehensive income (loss) for the years ended December 31, 2011 and 2010 were as follows:
Pension Benefits
Other Postretirement Benefits
2011
2010
2011
2010
Amortization of actuarial loss
$
(159)
$
(107)
$
—
$
—
Settlement loss
—
(20)
—
—
Amortization of prior service credit
9
9
1
1
Net loss arising during the year
237
298
24
7
Total
$
87
$
180
$
25
$
8