The Hartford 2011 Annual Report Download - page 70
Download and view the complete annual report
Please find page 70 of the 2011 The Hartford annual report below. You can navigate through the pages in the report by either clicking on the pages listed below, or by using the keyword search tool below to find specific information within the annual report.-
 1
1 -
2
-
3
-
4
-
5
-
6
-
7
-
8
-
9
-
10
-
11
-
12
-
13
-
14
-
15
-
16
-
17
-
18
-
19
-
20
-
21
-
22
-
23
-
24
-
25
-
26
-
27
-
28
-
29
-
30
-
31
-
32
-
33
-
34
-
35
-
36
-
37
-
38
-
39
-
40
-
41
-
42
-
43
-
44
-
45
-
46
-
47
-
48
-
49
-
50
-
51
-
52
-
53
-
54
-
55
-
56
-
57
-
58
-
59
-
 60
60 -
 61
61 -
 62
62 -
 63
63 -
 64
64 -
 65
65 -
 66
66 -
 67
67 -
 68
68 -
 69
69 -
 70
70 -
 71
71 -
 72
72 -
 73
73 -
 74
74 -
 75
75 -
 76
76 -
 77
77 -
 78
78 -
 79
79 -
 80
80 -
81
-
82
-
83
-
84
-
85
-
86
-
87
-
88
-
89
-
90
-
91
-
92
-
93
-
94
-
95
-
96
-
97
-
98
-
99
-
100
-
101
-
102
-
103
-
104
-
105
-
106
-
107
-
108
-
109
-
110
-
111
-
112
-
113
-
114
-
115
-
116
-
117
-
118
-
119
-
120
-
121
-
122
-
123
-
124
-
125
-
126
-
127
-
128
-
129
-
130
-
131
-
132
-
133
-
134
-
135
-
136
-
137
-
138
-
139
-
140
-
141
-
142
-
143
-
144
-
145
-
146
-
147
-
148
-
149
-
150
-
151
-
152
-
153
-
154
-
155
-
156
-
157
-
158
-
159
-
160
-
161
-
162
-
163
-
164
-
165
-
166
-
167
-
168
-
169
-
170
-
171
-
172
-
173
-
174
-
175
-
176
-
177
-
178
-
179
-
180
-
181
-
182
-
183
-
184
-
185
-
186
-
187
-
188
-
189
-
190
-
191
-
192
-
193
-
194
-
195
-
196
-
197
-
198
-
199
-
200
-
201
-
202
-
203
-
204
-
205
-
206
-
207
-
208
-
209
-
210
-
211
-
212
-
213
-
214
-
215
-
216
-
217
-
218
-
219
-
220
-
221
-
222
-
223
-
224
-
225
-
226
-
227
-
228
-
229
-
230
-
231
-
232
-
233
-
234
-
235
-
236
-
237
-
238
-
239
-
240
-
241
-
242
-
243
-
244
-
245
-
246
-
247
-
248
 |
 |

70
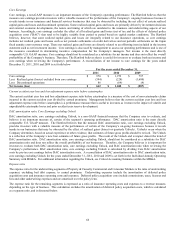
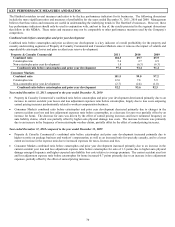
KEY PERFORMANCE MEASURES AND RATIOS
The Hartford considers several measures and ratios to be the key performance indicators for its businesses. The following discussions
include the more significant ratios and measures of profitability for the years ended December 31, 2011, 2010 and 2009. Management
believes that these ratios and measures are useful in understanding the underlying trends in The Hartford’ s businesses. However, these
key performance indicators should only be used in conjunction with, and not in lieu of, the results presented in the segment discussions
that follow in this MD&A. These ratios and measures may not be comparable to other performance measures used by the Company’ s
competitors.
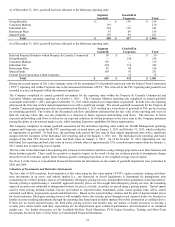
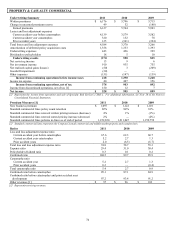
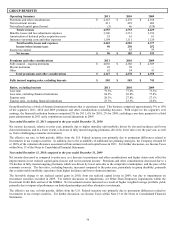
Combined ratio before catastrophes and prior year development
Combined ratio before catastrophes and prior accident year development is a key indicator of overall profitability for the property and
casualty underwriting segments of Property & Casualty Commercial and Consumer Markets since it removes the impact of volatile and
unpredictable catastrophe losses and prior accident year reserve development.
Property & Casualty Commercial
2011
2010
2009
Combined ratio
104.5
89.7
85.9
Catastrophe ratio
5.4
2.7
0.9
Non-catastrophe prior year development
1.8
(6.3)
(6.3)
Combined ratio before catastrophes and prior year development
97.2
93.4
91.2
Consumer Markets
Combined ratio
101.5
99.0
97.2
Catastrophe ratio
12.0
7.8
5.9
Non-catastrophe prior year development (2.7) (2.4) (1.0)
Combined ratio before catastrophes and prior year development
92.2
93.6
92.3
Year ended December 31, 2011 compared to the year ended December 31, 2010
• Property & Casualty Commercial’ s combined ratio before catastrophes and prior year development deteriorated primarily due to an
increase in current accident year losses and loss adjustment expenses ratio before catastrophes, largely due to loss costs outpacing
earned pricing increases predominantly related to workers compensation business.
• Consumer Markets combined ratio before catastrophes and prior year development decreased primarily due to changes in the
current accident year loss and loss adjustment expenses ratio before catastrophes, as a decrease for auto was partially offset by an
increase for home. The decrease for auto was driven by the effect of earned pricing increases and lower estimated frequency on
auto liability claims, which was partially offset by higher auto physical damage loss costs. The increase for home was primarily
due to an increase in the frequency of non-catastrophe weather claims, partially offset by the effect of earned pricing increases.
Year ended December 31, 2010 compared to the year ended December 31, 2009
• Property & Casualty Commercial’ s combined ratio before catastrophes and prior year development increased primarily due to
higher severity on package business and workers’ compensation, as well as an increased ratio for specialty casualty, and to a lesser
extent an increase in the expense ratio due to increased expenses for taxes, licenses and fees.
• Consumer Markets combined ratio before catastrophes and prior year development increased primarily due to an increase in the
current accident year loss and loss adjustment expense ratio before catastrophes for auto of 1.3 points due to higher auto physical
damage emerged frequency and higher expected auto liability loss costs relative to average premium. The current accident year loss
and loss adjustment expense ratio before catastrophes for home increased 0.7 points primarily due to an increase in loss adjustment
expenses, partially offset by the effect of earned pricing increases.