The Hartford 2011 Annual Report Download - page 105
Download and view the complete annual report
Please find page 105 of the 2011 The Hartford annual report below. You can navigate through the pages in the report by either clicking on the pages listed below, or by using the keyword search tool below to find specific information within the annual report.-
 1
1 -
2
-
3
-
4
-
5
-
6
-
7
-
8
-
9
-
10
-
11
-
12
-
13
-
14
-
15
-
16
-
17
-
18
-
19
-
20
-
21
-
22
-
23
-
24
-
25
-
26
-
27
-
28
-
29
-
30
-
31
-
32
-
33
-
34
-
35
-
36
-
37
-
38
-
39
-
40
-
41
-
42
-
43
-
44
-
45
-
46
-
47
-
48
-
49
-
50
-
51
-
52
-
53
-
54
-
55
-
56
-
57
-
58
-
59
-
60
-
61
-
62
-
63
-
64
-
65
-
66
-
67
-
68
-
69
-
70
-
71
-
72
-
73
-
74
-
75
-
76
-
77
-
78
-
79
-
80
-
81
-
82
-
83
-
84
-
85
-
86
-
87
-
88
-
89
-
90
-
91
-
92
-
93
-
94
-
 95
95 -
 96
96 -
 97
97 -
 98
98 -
 99
99 -
 100
100 -
 101
101 -
 102
102 -
 103
103 -
 104
104 -
 105
105 -
 106
106 -
 107
107 -
 108
108 -
 109
109 -
 110
110 -
 111
111 -
 112
112 -
 113
113 -
 114
114 -
 115
115 -
116
-
117
-
118
-
119
-
120
-
121
-
122
-
123
-
124
-
125
-
126
-
127
-
128
-
129
-
130
-
131
-
132
-
133
-
134
-
135
-
136
-
137
-
138
-
139
-
140
-
141
-
142
-
143
-
144
-
145
-
146
-
147
-
148
-
149
-
150
-
151
-
152
-
153
-
154
-
155
-
156
-
157
-
158
-
159
-
160
-
161
-
162
-
163
-
164
-
165
-
166
-
167
-
168
-
169
-
170
-
171
-
172
-
173
-
174
-
175
-
176
-
177
-
178
-
179
-
180
-
181
-
182
-
183
-
184
-
185
-
186
-
187
-
188
-
189
-
190
-
191
-
192
-
193
-
194
-
195
-
196
-
197
-
198
-
199
-
200
-
201
-
202
-
203
-
204
-
205
-
206
-
207
-
208
-
209
-
210
-
211
-
212
-
213
-
214
-
215
-
216
-
217
-
218
-
219
-
220
-
221
-
222
-
223
-
224
-
225
-
226
-
227
-
228
-
229
-
230
-
231
-
232
-
233
-
234
-
235
-
236
-
237
-
238
-
239
-
240
-
241
-
242
-
243
-
244
-
245
-
246
-
247
-
248
 |
 |

105
For GMIB contracts, in general, the policyholder has the right to elect to annuitize benefits, beginning (for certain products) on the tenth
or fifteenth anniversary year of contract commencement, receive lump sum payment of the then current account value, or remain in the
variable sub-account. For GMIB contracts, if the policyholder makes the election, the policyholder is entitled to receive the original
investment value over a 10- to 15- year annuitization period. A small percentage of the contracts will first become eligible to elect
annuitization beginning in 2013. The remainder of the contracts will first become eligible to elect annuitization from 2014 to 2022.
Because policyholders have various contractual rights to defer their annuitization election, the period over which annuitization election
can take place is subject to policyholder behavior and therefore indeterminate. In addition, upon annuitization the contractholder
surrenders access to the account value and the account value is transferred to the Company’ s general account where it is invested and
the additional investment proceeds are used towards payment of the original investment value. If the original investment value exceeds
the account value upon annuitization then the contract is “in the money”. As of December 31, 2011, 65% of retained NAR is reinsured
to an affiliate of The Hartford. For additional information on the Company’ s GMIB liability, see Note 9 of the Notes to Consolidated
Financial Statements.
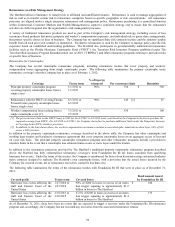
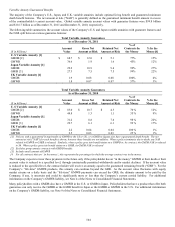
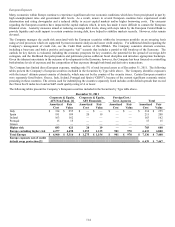
The following table represents the timing of account values eligible for annuitization under the Japan GMIB as of December 31, 2011,
as well as the NAR. The account values reflect 100% annuitization at the earliest point allowed by the contract and no adjustments for
future market returns and policyholder behaviors. Future market returns, changes in the value of the Japanese yen and policyholder
behaviors will impact account values eligible for annuitization in the years presented.
GMIB [1]
($ in billions)
Account Value
Net Amount at Risk
2013
$
0.3
$
—
2014
4.5
0.9
2015
7.3
2.0
2016
2.5
0.8
2017
2.8
0.9
2018 & beyond [2]
6.9
2.0
Total
$
24.3
$
6.6
[1] Excludes certain non-GMIB living benefits of $2.9 billion of account value and $0.9 billion of NAR.
[2] In 2018 & beyond, $2.6 billion of the $6.9 billion is primarily associated with account value that is eligible in 2021.
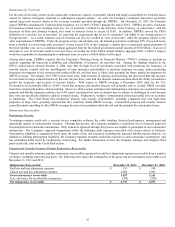
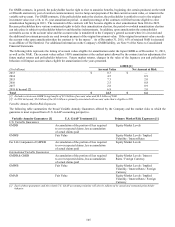
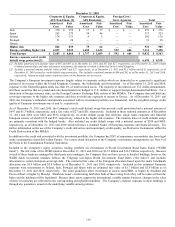
Variable Annuity Market Risk Exposures
The following table summarizes the broad Variable Annuity Guarantees offered by the Company and the market risks to which the
guarantee is most exposed from a U.S. GAAP accounting perspective.
Variable Annuity Guarantees [1]
U.S. GAAP Treatment [1]
Primary Market Risk Exposures [1]
U.S. Variable Guarantees
GMDB
Accumulation of the portion of fees required
to cover expected claims, less accumulation
of actual claims paid
Equity Market Levels
GMWB
Fair Value
Equity Market Levels / Implied
Volatility / Interest Rates
For Life Component of GMWB
Accumulation of the portion of fees required
to cover expected claims, less accumulation
of actual claims paid
Equity Market Levels
International Variable Guarantees
GMDB & GMIB
Accumulation of the portion of fees required
to cover expected claims, less accumulation
of actual claims paid
Equity Market Levels / Interest
Rates / Foreign Currency
GMWB
Fair Value
Equity Market Levels / Implied
Volatility / Interest Rates / Foreign
Currency
GMAB
Fair Value
Equity Market Levels / Implied
Volatility / Interest Rates / Foreign
Currency
[1] Each of these guarantees and the related U.S. GAAP accounting volatility will also be influenced by actual and estimated policyholder
behavior.