The Hartford 2011 Annual Report Download - page 217
Download and view the complete annual report
Please find page 217 of the 2011 The Hartford annual report below. You can navigate through the pages in the report by either clicking on the pages listed below, or by using the keyword search tool below to find specific information within the annual report.-
 1
1 -
2
-
3
-
4
-
5
-
6
-
7
-
8
-
9
-
10
-
11
-
12
-
13
-
14
-
15
-
16
-
17
-
18
-
19
-
20
-
21
-
22
-
23
-
24
-
25
-
26
-
27
-
28
-
29
-
30
-
31
-
32
-
33
-
34
-
35
-
36
-
37
-
38
-
39
-
40
-
41
-
42
-
43
-
44
-
45
-
46
-
47
-
48
-
49
-
50
-
51
-
52
-
53
-
54
-
55
-
56
-
57
-
58
-
59
-
60
-
61
-
62
-
63
-
64
-
65
-
66
-
67
-
68
-
69
-
70
-
71
-
72
-
73
-
74
-
75
-
76
-
77
-
78
-
79
-
80
-
81
-
82
-
83
-
84
-
85
-
86
-
87
-
88
-
89
-
90
-
91
-
92
-
93
-
94
-
95
-
96
-
97
-
98
-
99
-
100
-
101
-
102
-
103
-
104
-
105
-
106
-
107
-
108
-
109
-
110
-
111
-
112
-
113
-
114
-
115
-
116
-
117
-
118
-
119
-
120
-
121
-
122
-
123
-
124
-
125
-
126
-
127
-
128
-
129
-
130
-
131
-
132
-
133
-
134
-
135
-
136
-
137
-
138
-
139
-
140
-
141
-
142
-
143
-
144
-
145
-
146
-
147
-
148
-
149
-
150
-
151
-
152
-
153
-
154
-
155
-
156
-
157
-
158
-
159
-
160
-
161
-
162
-
163
-
164
-
165
-
166
-
167
-
168
-
169
-
170
-
171
-
172
-
173
-
174
-
175
-
176
-
177
-
178
-
179
-
180
-
181
-
182
-
183
-
184
-
185
-
186
-
187
-
188
-
189
-
190
-
191
-
192
-
193
-
194
-
195
-
196
-
197
-
198
-
199
-
200
-
201
-
202
-
203
-
204
-
205
-
206
-
 207
207 -
 208
208 -
 209
209 -
 210
210 -
 211
211 -
 212
212 -
 213
213 -
 214
214 -
 215
215 -
 216
216 -
 217
217 -
 218
218 -
 219
219 -
 220
220 -
 221
221 -
 222
222 -
 223
223 -
 224
224 -
 225
225 -
 226
226 -
 227
227 -
228
-
229
-
230
-
231
-
232
-
233
-
234
-
235
-
236
-
237
-
238
-
239
-
240
-
241
-
242
-
243
-
244
-
245
-
246
-
247
-
248
 |
 |

THE HARTFORD FINANCIAL SERVICES GROUP, INC.
NOTES TO CONSOLIDATED FINANCIAL STATEMENTS (continued)
F-82
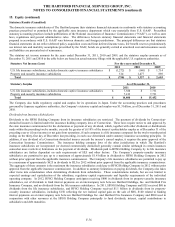
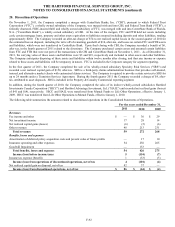
17. Employee Benefit Plans (continued)
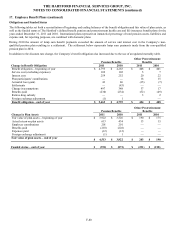
Amounts in accumulated other comprehensive income (loss) on a before tax basis that have not yet been recognized as components of
net periodic benefit cost consist of:
Pension Benefits
Other Postretirement Benefits
2011
2010
2011
2010
Net loss
$
1,930
$
1,852
$
39
$
17
Prior service credit
(21)
(30)
1
—
Transition obligation
—
—
2
—
Total
$
1,909
$
1,822
$
42
$
17
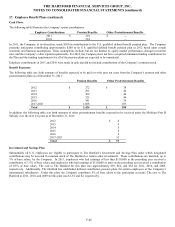
The estimated net loss and prior service credit for the defined benefit pension plans that will be amortized from accumulated other
comprehensive income (loss) into net periodic benefit cost during 2012 are $216 and $(9), respectively. The estimated net loss for the
other postretirement benefit plans that will be amortized from accumulated other comprehensive income (loss) into net periodic benefit
cost during 2012 is $(1). The estimated prior service credit for the other postretirement plans that will be amortized from accumulated
other comprehensive income into net periodic benefit cost during 2012 is an insignificant amount.
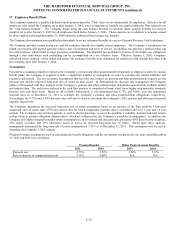
Plan Assets
Investment Strategy and Target Allocation
The overall investment strategy of the Plan is to maximize total investment returns to provide sufficient funding for present and
anticipated future benefit obligations within the constraints of a prudent level of portfolio risk and diversification. With respect to asset
management, the oversight responsibility of the Plan rests with The Hartford’ s Pension Fund Trust and Investment Committee
composed of individuals whose responsibilities include establishing overall objectives and the setting of investment policy; selecting
appropriate investment options and ranges; reviewing the asset allocation mix and asset allocation targets on a regular basis; and
monitoring performance to determine whether or not the rate of return objectives are being met and that policy and guidelines are being
followed. The Company believes that the asset allocation decision will be the single most important factor determining the long-term
performance of the Plan.
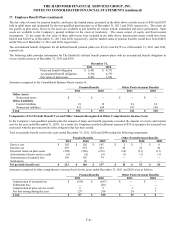
The Company’ s pension plan and other postretirement benefit plans’ target allocation by asset category is presented in the table below.
Target Asset Allocation
Pension Plans
Other Postretirement Plans
Equity securities
10% - 32%
15% - 35%
Fixed income securities
50% - 70%
55% - 85%
Alternative assets
10% - 25%
—
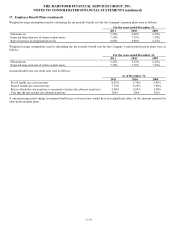
Divergent market performance among different asset classes may, from time to time, cause the asset allocation to deviate from the
desired asset allocation ranges. The asset allocation mix is reviewed on a periodic basis. If it is determined that an asset allocation mix
rebalancing is required, future portfolio additions and withdrawals will be used, as necessary, to bring the allocation within tactical
ranges.
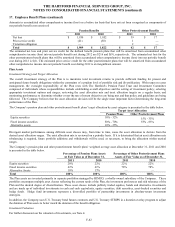
The Company’ s pension plan and other postretirement benefit plans’ weighted average asset allocation at December 31, 2011 and 2010
is presented in the table below.
Percentage of Pension Plans Assets
At Fair Value as of December 31,
Percentage of Other Postretirement Plans
Assets at Fair Value as of December 31,
2011
2010
2011
2010
Equity securities
20%
22%
22%
22%
Fixed income securities
62%
61%
78%
78%
Alternative Assets
18%
17%
—
—
Total
100%
100%
100%
100%
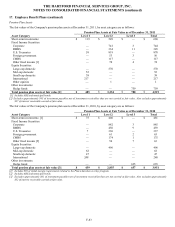
The Plan assets are invested primarily in separate portfolios managed by HIMCO, a wholly-owned subsidiary of the Company. These
portfolios encompass multiple asset classes reflecting the current needs of the Plan, the investment preferences and risk tolerance of the
Plan and the desired degree of diversification. These asset classes include publicly traded equities, bonds and alternative investments
and are made up of individual investments in cash and cash equivalents, equity securities, debt securities, asset-backed securities and
hedge funds. Hedge fund investments represent a diversified portfolio of partnership investments in absolute-return investment
strategies.
In addition, the Company uses U.S. Treasury bond futures contracts and U.S. Treasury STRIPS in a duration overlay program to adjust
the duration of Plan assets to better match the duration of the benefit obligation.
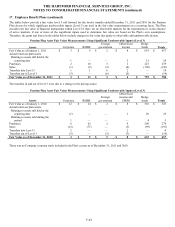
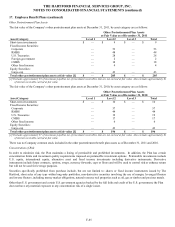
Investment Valuation
For further discussion on the valuation of investments, see Note 4.