The Hartford 2011 Annual Report Download - page 85
Download and view the complete annual report
Please find page 85 of the 2011 The Hartford annual report below. You can navigate through the pages in the report by either clicking on the pages listed below, or by using the keyword search tool below to find specific information within the annual report.-
 1
1 -
2
-
3
-
4
-
5
-
6
-
7
-
8
-
9
-
10
-
11
-
12
-
13
-
14
-
15
-
16
-
17
-
18
-
19
-
20
-
21
-
22
-
23
-
24
-
25
-
26
-
27
-
28
-
29
-
30
-
31
-
32
-
33
-
34
-
35
-
36
-
37
-
38
-
39
-
40
-
41
-
42
-
43
-
44
-
45
-
46
-
47
-
48
-
49
-
50
-
51
-
52
-
53
-
54
-
55
-
56
-
57
-
58
-
59
-
60
-
61
-
62
-
63
-
64
-
65
-
66
-
67
-
68
-
69
-
70
-
71
-
72
-
73
-
74
-
 75
75 -
 76
76 -
 77
77 -
 78
78 -
 79
79 -
 80
80 -
 81
81 -
 82
82 -
 83
83 -
 84
84 -
 85
85 -
 86
86 -
 87
87 -
 88
88 -
 89
89 -
 90
90 -
 91
91 -
 92
92 -
 93
93 -
 94
94 -
 95
95 -
96
-
97
-
98
-
99
-
100
-
101
-
102
-
103
-
104
-
105
-
106
-
107
-
108
-
109
-
110
-
111
-
112
-
113
-
114
-
115
-
116
-
117
-
118
-
119
-
120
-
121
-
122
-
123
-
124
-
125
-
126
-
127
-
128
-
129
-
130
-
131
-
132
-
133
-
134
-
135
-
136
-
137
-
138
-
139
-
140
-
141
-
142
-
143
-
144
-
145
-
146
-
147
-
148
-
149
-
150
-
151
-
152
-
153
-
154
-
155
-
156
-
157
-
158
-
159
-
160
-
161
-
162
-
163
-
164
-
165
-
166
-
167
-
168
-
169
-
170
-
171
-
172
-
173
-
174
-
175
-
176
-
177
-
178
-
179
-
180
-
181
-
182
-
183
-
184
-
185
-
186
-
187
-
188
-
189
-
190
-
191
-
192
-
193
-
194
-
195
-
196
-
197
-
198
-
199
-
200
-
201
-
202
-
203
-
204
-
205
-
206
-
207
-
208
-
209
-
210
-
211
-
212
-
213
-
214
-
215
-
216
-
217
-
218
-
219
-
220
-
221
-
222
-
223
-
224
-
225
-
226
-
227
-
228
-
229
-
230
-
231
-
232
-
233
-
234
-
235
-
236
-
237
-
238
-
239
-
240
-
241
-
242
-
243
-
244
-
245
-
246
-
247
-
248
 |
 |

85
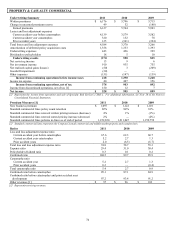
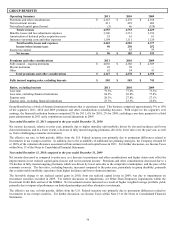
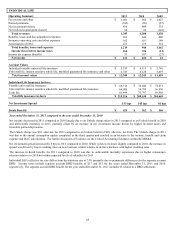
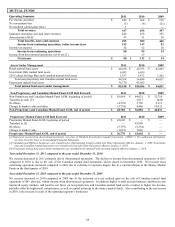
INDIVIDUAL LIFE
Operating Summary
2011
2010
2009
Fee income and other
$
1,001
$
952
$
1,027
Earned premiums
(102)
(96)
(87)
Net investment income
456
400
335
Net realized capital gains (losses)
30
24
(145)
Total revenues
1,385
1,280
1,130
Benefits, losses and loss adjustment expenses
816
644
640
Insurance operating costs and other expenses
182
181
188
Amortization of DAC
221
119
314
Total benefits, losses and expenses
1,219
944
1,142
Income (loss) before income taxes
166
336
(12)
Income tax expense (benefit)
33
107
(27)
Net income
$
133
$
229
$
15
Account Values
Individual variable universal life insurance
$
5,535
$
6,115
$
5,766
Universal life, interest sensitive whole life, modified guaranteed life insurance and other
6,765
6,128
5,693
Total account values
$
12,300
$
12,243
$
11,459
Individual Life Insurance In-force
Variable universal life insurance
$
69,716
$
74,044
$
78,671
Universal life, interest sensitive whole life, modified guaranteed life insurance
64,006
58,789
56,030
Term life
81,494
75,797
69,968
Total life insurance in-force
$
215,216
$
208,630
$
204,669
Net Investment Spread
153 bps
145 bps
81 bps
Death Benefits
$
423
$
362
$
346
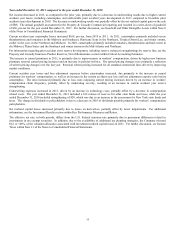
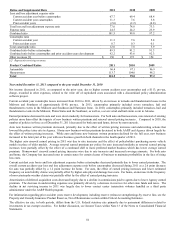
Year ended December 31, 2011 compared to the year ended December 31, 2010
Net income decreased in 2011 compared to 2010 largely due to an Unlock charge taken in 2011 compared to an Unlock benefit in 2010
and unfavorable mortality in 2011, partially offset by an increase in net investment income driven by higher invested assets and
favorable partnership income.
The Unlock charge was $69, after-tax, for 2011 compared to an Unlock benefit of $28, after-tax, for 2010. The Unlock charge in 2011
was due to the annual assumption update completed in the third quarter and resulted in an increase in fee income, benefit and claim
expense and DAC amortization. For further discussion of Unlocks see the Critical Accounting Estimates within the MD&A.
Net investment spread increased by 8 bps in 2011 compared to 2010. While yields were down slightly compared to 2010, the increase in
spread was driven by lower crediting rates on new business written relative to in-force business with higher crediting rates.
The increase in death benefits for 2011 compared to 2010 was due to unfavorable mortality experience due to higher reinsurance
retention relative to 2010 but within expected levels of volatility for 2011.
Individual Life’ s effective tax rate differs from the statutory rate of 35% primarily due to permanent differences for the separate account
DRD. Income taxes include separate account DRD benefits of $17 and $13 for the years ended December 31, 2011 and 2010,
respectively. The separate account DRD benefit for the year ended December 31, 2011 includes $5 related to a DRD settlement.