The Hartford 2011 Annual Report Download - page 214
Download and view the complete annual report
Please find page 214 of the 2011 The Hartford annual report below. You can navigate through the pages in the report by either clicking on the pages listed below, or by using the keyword search tool below to find specific information within the annual report.-
 1
1 -
2
-
3
-
4
-
5
-
6
-
7
-
8
-
9
-
10
-
11
-
12
-
13
-
14
-
15
-
16
-
17
-
18
-
19
-
20
-
21
-
22
-
23
-
24
-
25
-
26
-
27
-
28
-
29
-
30
-
31
-
32
-
33
-
34
-
35
-
36
-
37
-
38
-
39
-
40
-
41
-
42
-
43
-
44
-
45
-
46
-
47
-
48
-
49
-
50
-
51
-
52
-
53
-
54
-
55
-
56
-
57
-
58
-
59
-
60
-
61
-
62
-
63
-
64
-
65
-
66
-
67
-
68
-
69
-
70
-
71
-
72
-
73
-
74
-
75
-
76
-
77
-
78
-
79
-
80
-
81
-
82
-
83
-
84
-
85
-
86
-
87
-
88
-
89
-
90
-
91
-
92
-
93
-
94
-
95
-
96
-
97
-
98
-
99
-
100
-
101
-
102
-
103
-
104
-
105
-
106
-
107
-
108
-
109
-
110
-
111
-
112
-
113
-
114
-
115
-
116
-
117
-
118
-
119
-
120
-
121
-
122
-
123
-
124
-
125
-
126
-
127
-
128
-
129
-
130
-
131
-
132
-
133
-
134
-
135
-
136
-
137
-
138
-
139
-
140
-
141
-
142
-
143
-
144
-
145
-
146
-
147
-
148
-
149
-
150
-
151
-
152
-
153
-
154
-
155
-
156
-
157
-
158
-
159
-
160
-
161
-
162
-
163
-
164
-
165
-
166
-
167
-
168
-
169
-
170
-
171
-
172
-
173
-
174
-
175
-
176
-
177
-
178
-
179
-
180
-
181
-
182
-
183
-
184
-
185
-
186
-
187
-
188
-
189
-
190
-
191
-
192
-
193
-
194
-
195
-
196
-
197
-
198
-
199
-
200
-
201
-
202
-
203
-
 204
204 -
 205
205 -
 206
206 -
 207
207 -
 208
208 -
 209
209 -
 210
210 -
 211
211 -
 212
212 -
 213
213 -
 214
214 -
 215
215 -
 216
216 -
 217
217 -
 218
218 -
 219
219 -
 220
220 -
 221
221 -
 222
222 -
 223
223 -
 224
224 -
225
-
226
-
227
-
228
-
229
-
230
-
231
-
232
-
233
-
234
-
235
-
236
-
237
-
238
-
239
-
240
-
241
-
242
-
243
-
244
-
245
-
246
-
247
-
248
 |
 |

THE HARTFORD FINANCIAL SERVICES GROUP, INC.
NOTES TO CONSOLIDATED FINANCIAL STATEMENTS (continued)
F-79
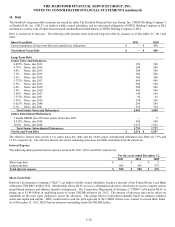
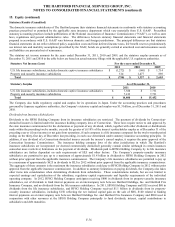
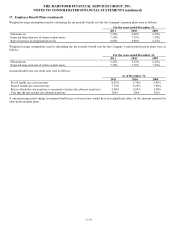
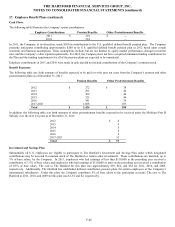
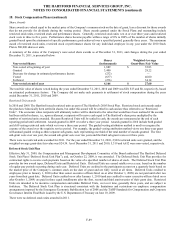
17. Employee Benefit Plans (continued)
Weighted average assumptions used in calculating the net periodic benefit cost for the Company’ s pension plans were as follows:
For the years ended December 31,
2011
2010
2009
Discount rate
5.50%
6.00%
6.25%
Expected long-term rate of return on plan assets
7.30%
7.30%
7.30%
Rate of increase in compensation levels
4.00%
4.00%
4.25%
Weighted average assumptions used in calculating the net periodic benefit cost for the Company’ s other postretirement plans were as
follows:
For the years ended December 31,
2011
2010
2009
Discount rate
5.25%
5.75%
6.25%
Expected long-term rate of return on plan assets
7.30%
7.30%
7.30%
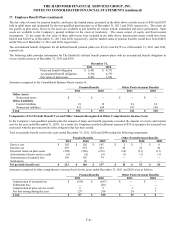
Assumed health care cost trend rates were as follows:
As of December 31,
2011
2010
2009
Pre-65 health care cost trend rate
8.95%
9.70%
9.05%
Post-65 health care cost trend rate
7.75%
8.25%
7.60%
Rate to which the cost trend rate is assumed to decline (the ultimate trend rate)
5.00%
5.00%
5.00%
Year that the rate reaches the ultimate trend rate
2019
2018
2018
A one-percentage point change in assumed health care cost trend rates would have an insignificant effect on the amounts reported for
other postretirement plans.