The Hartford 2011 Annual Report Download - page 51
Download and view the complete annual report
Please find page 51 of the 2011 The Hartford annual report below. You can navigate through the pages in the report by either clicking on the pages listed below, or by using the keyword search tool below to find specific information within the annual report.-
 1
1 -
2
-
3
-
4
-
5
-
6
-
7
-
8
-
9
-
10
-
11
-
12
-
13
-
14
-
15
-
16
-
17
-
18
-
19
-
20
-
21
-
22
-
23
-
24
-
25
-
26
-
27
-
28
-
29
-
30
-
31
-
32
-
33
-
34
-
35
-
36
-
37
-
38
-
39
-
40
-
 41
41 -
 42
42 -
 43
43 -
 44
44 -
 45
45 -
 46
46 -
 47
47 -
 48
48 -
 49
49 -
 50
50 -
 51
51 -
 52
52 -
 53
53 -
 54
54 -
 55
55 -
 56
56 -
 57
57 -
 58
58 -
 59
59 -
 60
60 -
 61
61 -
62
-
63
-
64
-
65
-
66
-
67
-
68
-
69
-
70
-
71
-
72
-
73
-
74
-
75
-
76
-
77
-
78
-
79
-
80
-
81
-
82
-
83
-
84
-
85
-
86
-
87
-
88
-
89
-
90
-
91
-
92
-
93
-
94
-
95
-
96
-
97
-
98
-
99
-
100
-
101
-
102
-
103
-
104
-
105
-
106
-
107
-
108
-
109
-
110
-
111
-
112
-
113
-
114
-
115
-
116
-
117
-
118
-
119
-
120
-
121
-
122
-
123
-
124
-
125
-
126
-
127
-
128
-
129
-
130
-
131
-
132
-
133
-
134
-
135
-
136
-
137
-
138
-
139
-
140
-
141
-
142
-
143
-
144
-
145
-
146
-
147
-
148
-
149
-
150
-
151
-
152
-
153
-
154
-
155
-
156
-
157
-
158
-
159
-
160
-
161
-
162
-
163
-
164
-
165
-
166
-
167
-
168
-
169
-
170
-
171
-
172
-
173
-
174
-
175
-
176
-
177
-
178
-
179
-
180
-
181
-
182
-
183
-
184
-
185
-
186
-
187
-
188
-
189
-
190
-
191
-
192
-
193
-
194
-
195
-
196
-
197
-
198
-
199
-
200
-
201
-
202
-
203
-
204
-
205
-
206
-
207
-
208
-
209
-
210
-
211
-
212
-
213
-
214
-
215
-
216
-
217
-
218
-
219
-
220
-
221
-
222
-
223
-
224
-
225
-
226
-
227
-
228
-
229
-
230
-
231
-
232
-
233
-
234
-
235
-
236
-
237
-
238
-
239
-
240
-
241
-
242
-
243
-
244
-
245
-
246
-
247
-
248
 |
 |

51
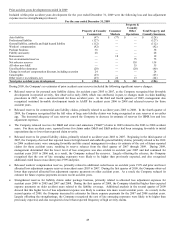
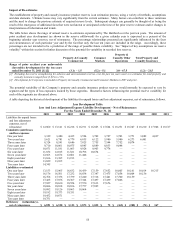
Property & Casualty Other Operations Claims
Reserve Activity
Reserves and reserve activity in Property & Casualty Other Operations are categorized and reported as asbestos, environmental, or “all
other”. The “all other” category of reserves covers a wide range of insurance and assumed reinsurance coverages, including, but not
limited to, potential liability for construction defects, lead paint, silica, pharmaceutical products, molestation and other long-tail
liabilities.
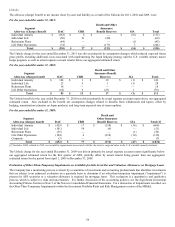
The following table presents reserve activity, inclusive of estimates for both reported and incurred but not reported claims, net of
reinsurance, for Property & Casualty Other Operations, categorized by asbestos, environmental and all other claims, for the years ended
December 31, 2011, 2010 and 2009.
Property & Casualty Other Operations Losses and Loss Adjustment Expenses
2011
Asbestos
Environmental
All Other [1]
Total
Beginning liability – net [2] [3]
$
1,787
$
334
$
1,302
$
3,423
Losses and loss adjustment expenses incurred
294
26
(3)
317
Losses and loss adjustment expenses paid
(189)
(40)
(140)
(369)
Ending liability – net [2] [3]
$
1,892 [4]
$
320
$
1,159
$
3,371
2010
Beginning liability – net [2] [3]
$
1,892
$
307
$
1,432
$
3,631
Losses and loss adjustment expenses incurred
189
67
(5)
251
Losses and loss adjustment expenses paid
(294)
(40)
(125)
(459)
Ending liability – net [2] [3]
$
1,787
$
334
$
1,302
$
3,423
2009
Beginning liability – net [2] [3]
$
1,884
$
269
$
1,628
$
3,781
Losses and loss adjustment expenses incurred
138
75
29
242
Losses and loss adjustment expenses paid
(181)
(40)
(171)
(392)
Reclassification of asbestos and environmental liabilities
51
3
(54)
—
Ending liability – net [2] [3]
$
1,892
$
307
$
1,432
$
3,631
[1] “All Other” includes unallocated loss adjustment expense reserves. “All Other” also includes The Company’s allowance for uncollectible
reinsurance. When the Company commutes a ceded reinsurance contract or settles a ceded reinsurance dispute, the portion of the allowance for
uncollectible reinsurance attributable to that commutation or settlement, if any, is reclassified to the appropriate cause of loss.
[2] Excludes amounts reported in Property & Casualty Commercial and Consumer Markets reporting segments (collectively “Ongoing Operations”)
for asbestos and environmental net liabilities of $15 and $8, respectively, as of December 31, 2011, $11 and $5, respectively, as of December 31,
2010, and $10 and $5, respectively, as of December 31, 2009; total net losses and loss adjustment expenses incurred for the years ended
December 31, 2011, 2010 and 2009 of $27, $15 and $16, respectively, related to asbestos and environmental claims; and total net losses and loss
adjustment expenses paid for the years ended December 31, 2011, 2010 and 2008 of $20, $14 and $19, respectively, related to asbestos and
environmental claims.
[3] Gross of reinsurance, asbestos and environmental reserves, including liabilities in Property & Casualty Commercial and Commercial Markets,
were $2,442 and $367, respectively, as of December 31, 2011; $2,308 and $378, respectively, as of December 31, 2010; and $2,484 and $367,
respectively, as of December 31, 2009.
[4] The one year and average three year net paid amounts for asbestos claims, including Ongoing Operations, were $198 and $230, respectively,
resulting in a one year net survival ratio of 9.6 and a three year net survival ratio of 8.3. Net survival ratio is the quotient of the net carried
reserves divided by the average annual payment amount and is an indication of the number of years that the net carried reserve would last (i.e.
survive) if the future annual claim payments were consistent with the calculated historical average.
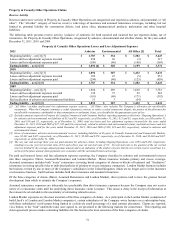
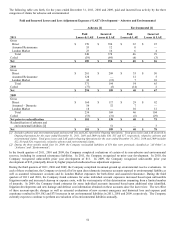
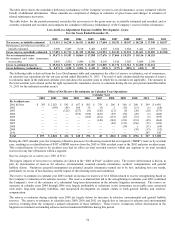
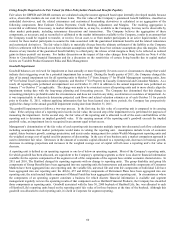
For paid and incurred losses and loss adjustment expenses reporting, the Company classifies its asbestos and environmental reserves
into three categories: Direct, Assumed Reinsurance and London Market. Direct insurance includes primary and excess coverage.
Assumed reinsurance includes both “treaty” reinsurance (covering broad categories of claims or blocks of business) and “facultative”
reinsurance (covering specific risks or individual policies of primary or excess insurance companies). London Market business includes
the business written by one or more of the Company’ s subsidiaries in the United Kingdom, which are no longer active in the insurance
or reinsurance business. Such business includes both direct insurance and assumed reinsurance.
Of the three categories of claims (Direct, Assumed Reinsurance and London Market), direct policies tend to have the greatest factual
development from which to estimate the Company’ s exposures.
Assumed reinsurance exposures are inherently less predictable than direct insurance exposures because the Company may not receive
notice of a reinsurance claim until the underlying direct insurance claim is mature. This causes a delay in the receipt of information at
the reinsurer level and adds to the uncertainty of estimating related reserves.
London Market exposures are the most uncertain of the three categories of claims. As a participant in the London Market (comprised of
both Lloyd’ s of London and London Market companies), certain subsidiaries of the Company wrote business on a subscription basis,
with those subsidiaries’ involvement being limited to a relatively small percentage of a total contract placement. Claims are reported,
via a broker, to the “lead” underwriter and, once agreed to, are presented to the following markets for concurrence. This reporting and
claim agreement process makes estimating liabilities for this business the most uncertain of the three categories of claims.