The Hartford 2011 Annual Report Download - page 74
Download and view the complete annual report
Please find page 74 of the 2011 The Hartford annual report below. You can navigate through the pages in the report by either clicking on the pages listed below, or by using the keyword search tool below to find specific information within the annual report.-
 1
1 -
2
-
3
-
4
-
5
-
6
-
7
-
8
-
9
-
10
-
11
-
12
-
13
-
14
-
15
-
16
-
17
-
18
-
19
-
20
-
21
-
22
-
23
-
24
-
25
-
26
-
27
-
28
-
29
-
30
-
31
-
32
-
33
-
34
-
35
-
36
-
37
-
38
-
39
-
40
-
41
-
42
-
43
-
44
-
45
-
46
-
47
-
48
-
49
-
50
-
51
-
52
-
53
-
54
-
55
-
56
-
57
-
58
-
59
-
60
-
61
-
62
-
63
-
 64
64 -
 65
65 -
 66
66 -
 67
67 -
 68
68 -
 69
69 -
 70
70 -
 71
71 -
 72
72 -
 73
73 -
 74
74 -
 75
75 -
 76
76 -
 77
77 -
 78
78 -
 79
79 -
 80
80 -
 81
81 -
 82
82 -
 83
83 -
 84
84 -
85
-
86
-
87
-
88
-
89
-
90
-
91
-
92
-
93
-
94
-
95
-
96
-
97
-
98
-
99
-
100
-
101
-
102
-
103
-
104
-
105
-
106
-
107
-
108
-
109
-
110
-
111
-
112
-
113
-
114
-
115
-
116
-
117
-
118
-
119
-
120
-
121
-
122
-
123
-
124
-
125
-
126
-
127
-
128
-
129
-
130
-
131
-
132
-
133
-
134
-
135
-
136
-
137
-
138
-
139
-
140
-
141
-
142
-
143
-
144
-
145
-
146
-
147
-
148
-
149
-
150
-
151
-
152
-
153
-
154
-
155
-
156
-
157
-
158
-
159
-
160
-
161
-
162
-
163
-
164
-
165
-
166
-
167
-
168
-
169
-
170
-
171
-
172
-
173
-
174
-
175
-
176
-
177
-
178
-
179
-
180
-
181
-
182
-
183
-
184
-
185
-
186
-
187
-
188
-
189
-
190
-
191
-
192
-
193
-
194
-
195
-
196
-
197
-
198
-
199
-
200
-
201
-
202
-
203
-
204
-
205
-
206
-
207
-
208
-
209
-
210
-
211
-
212
-
213
-
214
-
215
-
216
-
217
-
218
-
219
-
220
-
221
-
222
-
223
-
224
-
225
-
226
-
227
-
228
-
229
-
230
-
231
-
232
-
233
-
234
-
235
-
236
-
237
-
238
-
239
-
240
-
241
-
242
-
243
-
244
-
245
-
246
-
247
-
248
 |
 |

74
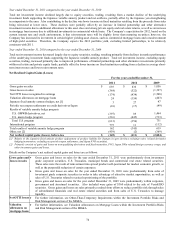
Year ended December 31, 2011 compared to the year ended December 31, 2010
Total net investment income declined largely due to equity securities, trading, resulting from a market decline of the underlying
investment funds supporting the Japanese variable annuity product and net outflows, partially offset by the Japanese yen strengthening
in comparison to the euro. Also contributing to the decline was lower income on fixed maturities resulting from the proceeds from sales
being reinvested at lower rates. These declines were partially offset by an increase in limited partnership and other alternative
investment income due to additional allocations to this asset class and strong private equity and real estate returns, as well as an increase
in mortgage loan income due to additional investments in commercial whole loans. The Company’ s expectation for 2012, based on the
current interest rate and credit environment, is that reinvestment rates will be slightly lower than maturing securities; however, the
Company has increased its investment in certain higher yielding asset classes, such as commercial mortgage loans and a modest amount
of high-yield securities. Therefore, the Company expects the 2012 portfolio yield, excluding limited partnerships, to be relatively
consistent with 2011.
Year ended December 31, 2010 compared to the year ended December 31, 2009
Total net investment income decreased largely due to equity securities, trading, resulting primarily from declines in market performance
of the underlying investment funds supporting the Japanese variable annuity product. Total net investment income, excluding equity
securities, trading, increased primarily due to improved performance of limited partnerships and other alternative investments primarily
within real estate and private equity funds, partially offset by lower income on fixed maturities resulting from a decline in average short-
term interest rates and lower reinvestment rates.
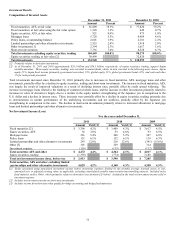
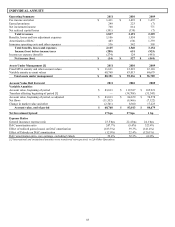
Net Realized Capital Gains (Losses)
For the years ended December 31,
2011
2010
2009
Gross gains on sales
$
693
$
836
$
1,056
Gross losses on sales
(384)
(522)
(1,397)
Net OTTI losses recognized in earnings
(174)
(434)
(1,508)
Valuation allowances on mortgage loans
24
(154)
(403)
Japanese fixed annuity contract hedges, net [1]
3
27
47
Periodic net coupon settlements on credit derivatives/Japan
(10)
(17)
(49)
Results of variable annuity hedge program
U.S. GMWB derivatives, net
(397)
89
1,464
U.S. macro hedge program
(216)
(445)
(733)
Total U.S. program
(613)
(356)
731
International program
775
11
(112)
Total results of variable annuity hedge program
162
(345)
619
Other, net [2]
(459)
(2)
(369)
Net realized capital gains (losses), before-tax
$
(145)
$
(611)
$
(2,004)
[1] Relates to the Japanese fixed annuity product (adjustment of product liability for changes in spot currency exchange rates, related derivative
hedging instruments, excluding net period coupon settlements, and Japan FVO securities).
[2] Primarily consists of gains and losses on non-qualifying derivatives and fixed maturities, FVO, Japan 3Win related foreign currency swaps, and
other investment gains and losses.
Details on the Company’ s net realized capital gains and losses are as follows:
Gross gains and
losses on sales
• Gross gains and losses on sales for the year ended December 31, 2011 were predominately from investment
grade corporate securities, U.S. Treasuries, municipal bonds and commercial real estate related securities.
These sales were the result of reinvestment into spread product well-positioned for modest economic growth, as
well as the purposeful reduction of certain exposures.
• Gross gains and losses on sales for the year ended December 31, 2010 were predominantly from sales of
investment grade corporate securities in order to take advantage of attractive market opportunities, as well as
sales of U.S. Treasuries related to tactical repositioning of the portfolio.
• Gross gains and losses on sales for the year ended December 31, 2009 were predominantly within corporate,
government and structured securities. Also included were gains of $360 related to the sale of Verisk/ISO
securities. Gross gains and losses on sales primarily resulted from efforts to reduce portfolio risk through sales
of subordinated financials and real estate related securities and from sales of U.S. Treasuries to manage
liquidity.
Net OTTI losses
• For further information, see Other-Than-Temporary Impairments within the Investment Portfolio Risks and
Risk Management section of the MD&A.
Valuation
allowances on
mortgage loans
• For further information, see Valuation Allowances on Mortgage Loans within the Investment Portfolio Risks
and Risk Management section of the MD&A.