The Hartford 2011 Annual Report Download - page 140
Download and view the complete annual report
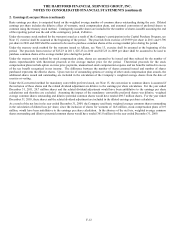
Please find page 140 of the 2011 The Hartford annual report below. You can navigate through the pages in the report by either clicking on the pages listed below, or by using the keyword search tool below to find specific information within the annual report.-
 1
1 -
2
-
3
-
4
-
5
-
6
-
7
-
8
-
9
-
10
-
11
-
12
-
13
-
14
-
15
-
16
-
17
-
18
-
19
-
20
-
21
-
22
-
23
-
24
-
25
-
26
-
27
-
28
-
29
-
30
-
31
-
32
-
33
-
34
-
35
-
36
-
37
-
38
-
39
-
40
-
41
-
42
-
43
-
44
-
45
-
46
-
47
-
48
-
49
-
50
-
51
-
52
-
53
-
54
-
55
-
56
-
57
-
58
-
59
-
60
-
61
-
62
-
63
-
64
-
65
-
66
-
67
-
68
-
69
-
70
-
71
-
72
-
73
-
74
-
75
-
76
-
77
-
78
-
79
-
80
-
81
-
82
-
83
-
84
-
85
-
86
-
87
-
88
-
89
-
90
-
91
-
92
-
93
-
94
-
95
-
96
-
97
-
98
-
99
-
100
-
101
-
102
-
103
-
104
-
105
-
106
-
107
-
108
-
109
-
110
-
111
-
112
-
113
-
114
-
115
-
116
-
117
-
118
-
119
-
120
-
121
-
122
-
123
-
124
-
125
-
126
-
127
-
128
-
129
-
 130
130 -
 131
131 -
 132
132 -
 133
133 -
 134
134 -
 135
135 -
 136
136 -
 137
137 -
 138
138 -
 139
139 -
 140
140 -
 141
141 -
 142
142 -
 143
143 -
 144
144 -
 145
145 -
 146
146 -
 147
147 -
 148
148 -
 149
149 -
 150
150 -
151
-
152
-
153
-
154
-
155
-
156
-
157
-
158
-
159
-
160
-
161
-
162
-
163
-
164
-
165
-
166
-
167
-
168
-
169
-
170
-
171
-
172
-
173
-
174
-
175
-
176
-
177
-
178
-
179
-
180
-
181
-
182
-
183
-
184
-
185
-
186
-
187
-
188
-
189
-
190
-
191
-
192
-
193
-
194
-
195
-
196
-
197
-
198
-
199
-
200
-
201
-
202
-
203
-
204
-
205
-
206
-
207
-
208
-
209
-
210
-
211
-
212
-
213
-
214
-
215
-
216
-
217
-
218
-
219
-
220
-
221
-
222
-
223
-
224
-
225
-
226
-
227
-
228
-
229
-
230
-
231
-
232
-
233
-
234
-
235
-
236
-
237
-
238
-
239
-
240
-
241
-
242
-
243
-
244
-
245
-
246
-
247
-
248
 |
 |

F-5
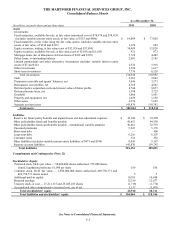
THE HARTFORD FINANCIAL SERVICES GROUP, INC.
Consolidated Balance Sheets
As of December 31,
(In millions, except for share and per share data)
2011
2010
Assets
Investments:
Fixed maturities, available-for-sale, at fair value (amortized cost of $78,978 and $78,419)
(includes variable interest entity assets, at fair value, of $153 and $406)
$
81,809
$
77,820
Fixed maturities, at fair value using the fair value option (includes variable interest entity
assets, at fair value, of $338 and $323)
1,328
649
Equity securities, trading, at fair value (cost of $32,928 and $33,899)
30,499
32,820
Equity securities, available-for-sale, at fair value (cost of $1,056 and $1,013)
921
973
Mortgage loans (net of allowances for loan losses of $102 and $155)
5,728
4,489
Policy loans, at outstanding balance
2,001
2,181
Limited partnerships and other alternative investments (includes variable interest entity
assets of $7 and $14)
2,532
1,918
Other investments
2,394
1,617
Short-term investments
7,736
8,528
Total investments
134,948
130,995
Cash
2,581
2,062
Premiums receivable and agents’ balances, net
3,446
3,273
Reinsurance recoverables, net
4,768
4,862
Deferred policy acquisition costs and present value of future profits
8,744
9,857
Deferred income taxes, net
1,398
3,725
Goodwill
1,006
1,051
Property and equipment, net
1,029
1,150
Other assets
2,274
1,629
Separate account assets
143,870
159,742
Total assets
$
304,064
$
318,346
Liabilities
Reserve for future policy benefits and unpaid losses and loss adjustment expenses
$
41,016
$
39,598
Other policyholder funds and benefits payable
45,612
44,550
Other policyholder funds and benefits payable – international variable annuities
30,461
32,793
Unearned premiums
5,222
5,176
Short-term debt
—
400
Long-term debt
6,216
6,207
Consumer notes
314
382
Other liabilities (includes variable interest entity liabilities of $471 and $394)
8,443
9,187
Separate account liabilities
143,870
159,742
Total liabilities
281,154
298,035
Commitments and Contingencies (Note 12)
Stockholders’ Equity
Preferred stock, $0.01 par value — 50,000,000 shares authorized, 575,000 shares
issued, liquidation preference $1,000 per share
556
556
Common stock, $0.01 par value — 1,500,000,000 shares authorized, 469,750,171 and
469,754,771 shares issued
5
5
Additional paid-in capital
10,391
10,448
Retained earnings
12,519
12,077
Treasury stock, at cost — 27,211,115 and 25,205,283 shares
(1,718)
(1,774)
Accumulated other comprehensive income (loss), net of tax
1,157
(1,001)
Total stockholders’ equity
22,910
20,311
Total liabilities and stockholders’ equity
$
304,064
$
318,346
See Notes to Consolidated Financial Statements.