The Hartford 2011 Annual Report Download - page 153
Download and view the complete annual report
Please find page 153 of the 2011 The Hartford annual report below. You can navigate through the pages in the report by either clicking on the pages listed below, or by using the keyword search tool below to find specific information within the annual report.-
 1
1 -
2
-
3
-
4
-
5
-
6
-
7
-
8
-
9
-
10
-
11
-
12
-
13
-
14
-
15
-
16
-
17
-
18
-
19
-
20
-
21
-
22
-
23
-
24
-
25
-
26
-
27
-
28
-
29
-
30
-
31
-
32
-
33
-
34
-
35
-
36
-
37
-
38
-
39
-
40
-
41
-
42
-
43
-
44
-
45
-
46
-
47
-
48
-
49
-
50
-
51
-
52
-
53
-
54
-
55
-
56
-
57
-
58
-
59
-
60
-
61
-
62
-
63
-
64
-
65
-
66
-
67
-
68
-
69
-
70
-
71
-
72
-
73
-
74
-
75
-
76
-
77
-
78
-
79
-
80
-
81
-
82
-
83
-
84
-
85
-
86
-
87
-
88
-
89
-
90
-
91
-
92
-
93
-
94
-
95
-
96
-
97
-
98
-
99
-
100
-
101
-
102
-
103
-
104
-
105
-
106
-
107
-
108
-
109
-
110
-
111
-
112
-
113
-
114
-
115
-
116
-
117
-
118
-
119
-
120
-
121
-
122
-
123
-
124
-
125
-
126
-
127
-
128
-
129
-
130
-
131
-
132
-
133
-
134
-
135
-
136
-
137
-
138
-
139
-
140
-
141
-
142
-
 143
143 -
 144
144 -
 145
145 -
 146
146 -
 147
147 -
 148
148 -
 149
149 -
 150
150 -
 151
151 -
 152
152 -
 153
153 -
 154
154 -
 155
155 -
 156
156 -
 157
157 -
 158
158 -
 159
159 -
 160
160 -
 161
161 -
 162
162 -
 163
163 -
164
-
165
-
166
-
167
-
168
-
169
-
170
-
171
-
172
-
173
-
174
-
175
-
176
-
177
-
178
-
179
-
180
-
181
-
182
-
183
-
184
-
185
-
186
-
187
-
188
-
189
-
190
-
191
-
192
-
193
-
194
-
195
-
196
-
197
-
198
-
199
-
200
-
201
-
202
-
203
-
204
-
205
-
206
-
207
-
208
-
209
-
210
-
211
-
212
-
213
-
214
-
215
-
216
-
217
-
218
-
219
-
220
-
221
-
222
-
223
-
224
-
225
-
226
-
227
-
228
-
229
-
230
-
231
-
232
-
233
-
234
-
235
-
236
-
237
-
238
-
239
-
240
-
241
-
242
-
243
-
244
-
245
-
246
-
247
-
248
 |
 |

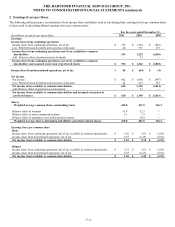
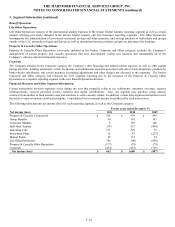
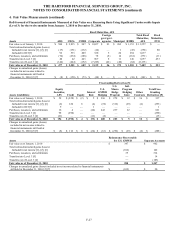
THE HARTFORD FINANCIAL SERVICES GROUP, INC.
NOTES TO CONSOLIDATED FINANCIAL STATEMENTS (continued)
F-18
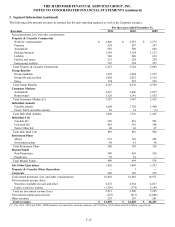
4. Fair Value Measurements (continued)
These disclosures provide information as to the extent to which the Company uses fair value to measure financial instruments and
information about the inputs used to value those financial instruments to allow users to assess the relative reliability of the
measurements. The following tables present assets and (liabilities) carried at fair value by hierarchy level.
December 31, 2011
Total
Quoted Prices in
Active Markets
for Identical
Assets
(Level 1)
Significant
Observable
Inputs
(Level 2)
Significant
Unobservable
Inputs
(Level 3)
Assets accounted for at fair value on a recurring basis
Fixed maturities, AFS
ABS
$
3,153
$
—
$
2,792
$
361
CDOs
2,487
—
2,119
368
CMBS
6,951
—
6,363
588
Corporate
44,011
—
41,756
2,255
Foreign government/government agencies
2,161
—
2,112
49
States, municipalities and political subdivisions (“Municipal”)
13,260
—
12,823
437
RMBS
5,757
—
4,694
1,063
U.S. Treasuries
4,029
750
3,279
—
Total fixed maturities
81,809
750
75,938
5,121
Fixed maturities, FVO
1,328
—
833
495
Equity securities, trading
30,499
1,967
28,532
—
Equity securities, AFS
921
352
476
93
Derivative assets
Credit derivatives
(24)
—
(11)
(13)
Equity derivatives
31
—
—
31
Foreign exchange derivatives
519
—
519
—
Interest rate derivatives
195
—
147
48
U.S. GMWB hedging instruments
494
—
11
483
U.S. macro hedge program
357
—
—
357
International program hedging instruments
731
—
692
39
Other derivative contracts
28
—
—
28
Total derivative assets [1]
2,331
—
1,358
973
Short-term investments
7,736
750
6,986
—
Reinsurance recoverable for U.S. GMWB
443
—
—
443
Separate account assets [2]
139,432
101,644
36,757
1,031
Total assets accounted for at fair value on a recurring basis
$
264,499
$
105,463
$
150,880
$
8,156
Percentage of level to total
100%
40%
57%
3%
Liabilities accounted for at fair value on a recurring basis
Other policyholder funds and benefits payable
U.S. guaranteed withdrawal benefits
$
(2,538)
$
—
$
—
$
(2,538)
International guaranteed withdrawal benefits
(66)
—
—
(66)
International other guaranteed living benefits
(5)
—
—
(5)
Equity linked notes
(9)
—
—
(9)
Total other policyholder funds and benefits payable
(2,618)
—
—
(2,618)
Derivative liabilities
Credit derivatives
(573)
—
(25)
(548)
Equity derivatives
9
—
—
9
Foreign exchange derivatives
134
—
134
—
Interest rate derivatives
(527)
—
(421)
(106)
U.S. GMWB hedging instruments
400
—
—
400
International program hedging instruments
19
—
23
(4)
Total derivative liabilities [3]
(538)
—
(289)
(249)
Other Liabilities
(9)
—
—
(9)
Consumer notes [4]
(4)
—
—
(4)
Total liabilities accounted for at fair value on a recurring basis
$
(3,169)
$
—
$
(289)
$
(2,880)