The Hartford 2011 Annual Report Download - page 73
Download and view the complete annual report
Please find page 73 of the 2011 The Hartford annual report below. You can navigate through the pages in the report by either clicking on the pages listed below, or by using the keyword search tool below to find specific information within the annual report.-
 1
1 -
2
-
3
-
4
-
5
-
6
-
7
-
8
-
9
-
10
-
11
-
12
-
13
-
14
-
15
-
16
-
17
-
18
-
19
-
20
-
21
-
22
-
23
-
24
-
25
-
26
-
27
-
28
-
29
-
30
-
31
-
32
-
33
-
34
-
35
-
36
-
37
-
38
-
39
-
40
-
41
-
42
-
43
-
44
-
45
-
46
-
47
-
48
-
49
-
50
-
51
-
52
-
53
-
54
-
55
-
56
-
57
-
58
-
59
-
60
-
61
-
62
-
 63
63 -
 64
64 -
 65
65 -
 66
66 -
 67
67 -
 68
68 -
 69
69 -
 70
70 -
 71
71 -
 72
72 -
 73
73 -
 74
74 -
 75
75 -
 76
76 -
 77
77 -
 78
78 -
 79
79 -
 80
80 -
 81
81 -
 82
82 -
 83
83 -
84
-
85
-
86
-
87
-
88
-
89
-
90
-
91
-
92
-
93
-
94
-
95
-
96
-
97
-
98
-
99
-
100
-
101
-
102
-
103
-
104
-
105
-
106
-
107
-
108
-
109
-
110
-
111
-
112
-
113
-
114
-
115
-
116
-
117
-
118
-
119
-
120
-
121
-
122
-
123
-
124
-
125
-
126
-
127
-
128
-
129
-
130
-
131
-
132
-
133
-
134
-
135
-
136
-
137
-
138
-
139
-
140
-
141
-
142
-
143
-
144
-
145
-
146
-
147
-
148
-
149
-
150
-
151
-
152
-
153
-
154
-
155
-
156
-
157
-
158
-
159
-
160
-
161
-
162
-
163
-
164
-
165
-
166
-
167
-
168
-
169
-
170
-
171
-
172
-
173
-
174
-
175
-
176
-
177
-
178
-
179
-
180
-
181
-
182
-
183
-
184
-
185
-
186
-
187
-
188
-
189
-
190
-
191
-
192
-
193
-
194
-
195
-
196
-
197
-
198
-
199
-
200
-
201
-
202
-
203
-
204
-
205
-
206
-
207
-
208
-
209
-
210
-
211
-
212
-
213
-
214
-
215
-
216
-
217
-
218
-
219
-
220
-
221
-
222
-
223
-
224
-
225
-
226
-
227
-
228
-
229
-
230
-
231
-
232
-
233
-
234
-
235
-
236
-
237
-
238
-
239
-
240
-
241
-
242
-
243
-
244
-
245
-
246
-
247
-
248
 |
 |
73
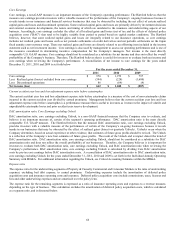
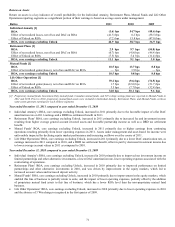
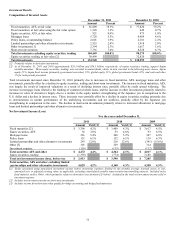
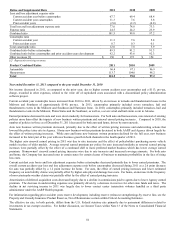
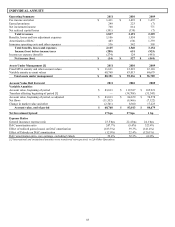
Investment Results
Composition of Invested Assets
December 31, 2011
December 31, 2010
Amount
Percent
Amount
Percent
Fixed maturities, AFS, at fair value
$
81,809
78.3%
$
77,820
79.2%
Fixed maturities, at fair value using the fair value option
1,328
1.3%
649
0.7%
Equity securities, AFS, at fair value
921
0.9%
973
1.0%
Mortgage loans
5,728
5.5%
4,489
4.6%
Policy loans, at outstanding balance
2,001
1.9%
2,181
2.2%
Limited partnerships and other alternative investments
2,532
2.4%
1,918
2.0%
Other investments [1]
2,394
2.3%
1,617
1.6%
Short-term investments
7,736
7.4%
8,528
8.7%
Total investments excluding equity securities, trading
104,449
100.0%
98,175
100.0%
Equity securities, trading, at fair value [2]
30,499
32,820
Total investments
$
134,948
$
130,995
[1] Primarily relates to derivative instruments.
[2] As of December 31, 2011 and 2010, approximately $28.5 billion and $30.5 billion, respectively, of equity securities, trading, support Japan
variable annuities. Those equity securities, trading, were invested in mutual funds, which, in turn, invested in the following asset classes, Japan
equity 21%, Japan fixed income (primarily government securities) 15%, global equity 21%, global government bonds 42%, and cash and other
1% for both periods presented.
Total investments increased since December 31, 2010 primarily due to increases in fixed maturities, AFS, mortgage loans and other
investments, partially offset by a decline in equity securities, trading and short-term investments. The increase in fixed maturities, AFS,
was largely the result of improved valuations as a result of declining interest rates, partially offset by credit spread widening. The
increase in mortgage loans related to the funding of commercial whole loans, and the increase in other investments primarily related to
increases in value of derivatives largely due to a decline in the equity market, strengthening of the Japanese yen in comparison to the
U.S. dollar and a decline in interest rates. These increases were partially offset by a decline in equity securities, trading, primarily due
to deteriorations in market performance of the underlying investments and net outflows, partially offset by the Japanese yen
strengthening in comparison to the euro. The decline in short-term investments primarily relates to increased allocations to mortgage
loans and limited partnerships and other alternative investments.
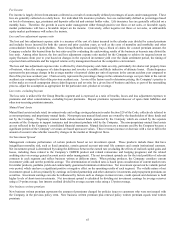
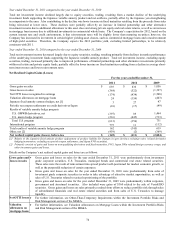
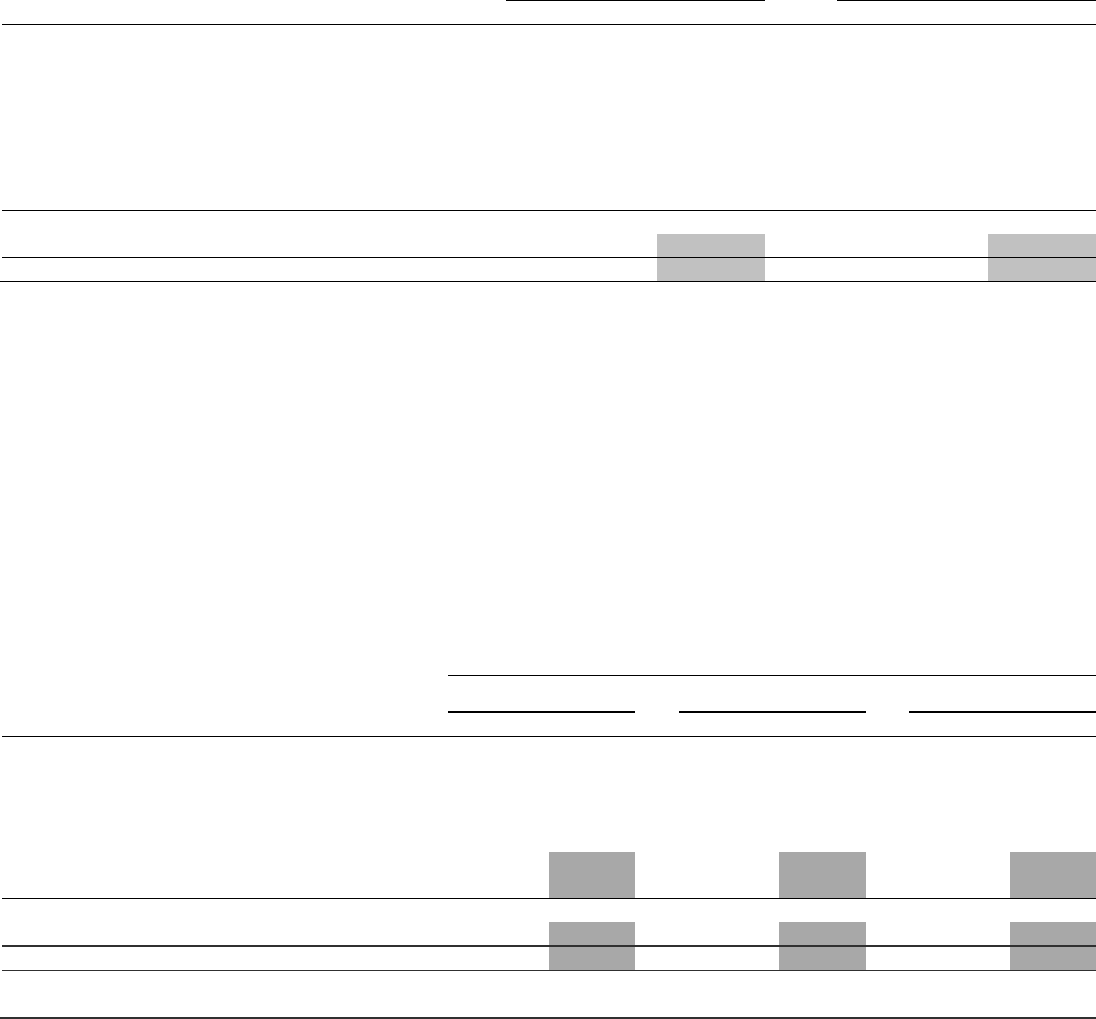
Net Investment Income (Loss)
For the years ended December 31,
2011
2010
2009
Amount
Yield [1]
Amount
Yield [1]
Amount
Yield [1]
Fixed maturities [2]
$
3,396
4.2%
$
3,489
4.3%
$
3,617
4.5%
Equity securities, AFS
36
3.8%
53
4.8%
93
6.5%
Mortgage loans
281
5.4%
260
5.2%
307
4.8%
Policy loans
131
6.1%
132
6.1%
139
6.3%
Limited partnerships and other alternative investments
243
12.0%
216
12.6%
(341)
(15.6%)
Other [3]
301
329
314
Investment expense
(116)
(115)
(112)
Total securities AFS and other
$
4,272
4.4%
$
4,364
4.5%
$
4,017
4.1%
Equity securities, trading
(1,359)
(774)
3,188
Total net investment income (loss), before-tax
$
2,913
$
3,590
$
7,205
Total securities, AFS and other excluding limited
partnerships and other alternative investments
4,029
4.2%
4,148
4.3%
4,358
4.5%
[1] Yields calculated using annualized investment income before investment expenses divided by the monthly average invested assets at cost,
amortized cost, or adjusted carrying value, as applicable, excluding consolidated variable interest entity noncontrolling interests. Included in the
fixed maturity yield is Other, which primarily relates to derivatives (see footnote [3] below). Included in the total net investment income yield is
investment expense.
[2] Includes net investment income on short-term investments.
[3] Includes income from derivatives that qualify for hedge accounting and hedge fixed maturities.