The Hartford 2011 Annual Report Download - page 171
Download and view the complete annual report
Please find page 171 of the 2011 The Hartford annual report below. You can navigate through the pages in the report by either clicking on the pages listed below, or by using the keyword search tool below to find specific information within the annual report.-
 1
1 -
2
-
3
-
4
-
5
-
6
-
7
-
8
-
9
-
10
-
11
-
12
-
13
-
14
-
15
-
16
-
17
-
18
-
19
-
20
-
21
-
22
-
23
-
24
-
25
-
26
-
27
-
28
-
29
-
30
-
31
-
32
-
33
-
34
-
35
-
36
-
37
-
38
-
39
-
40
-
41
-
42
-
43
-
44
-
45
-
46
-
47
-
48
-
49
-
50
-
51
-
52
-
53
-
54
-
55
-
56
-
57
-
58
-
59
-
60
-
61
-
62
-
63
-
64
-
65
-
66
-
67
-
68
-
69
-
70
-
71
-
72
-
73
-
74
-
75
-
76
-
77
-
78
-
79
-
80
-
81
-
82
-
83
-
84
-
85
-
86
-
87
-
88
-
89
-
90
-
91
-
92
-
93
-
94
-
95
-
96
-
97
-
98
-
99
-
100
-
101
-
102
-
103
-
104
-
105
-
106
-
107
-
108
-
109
-
110
-
111
-
112
-
113
-
114
-
115
-
116
-
117
-
118
-
119
-
120
-
121
-
122
-
123
-
124
-
125
-
126
-
127
-
128
-
129
-
130
-
131
-
132
-
133
-
134
-
135
-
136
-
137
-
138
-
139
-
140
-
141
-
142
-
143
-
144
-
145
-
146
-
147
-
148
-
149
-
150
-
151
-
152
-
153
-
154
-
155
-
156
-
157
-
158
-
159
-
160
-
 161
161 -
 162
162 -
 163
163 -
 164
164 -
 165
165 -
 166
166 -
 167
167 -
 168
168 -
 169
169 -
 170
170 -
 171
171 -
 172
172 -
 173
173 -
 174
174 -
 175
175 -
 176
176 -
 177
177 -
 178
178 -
 179
179 -
 180
180 -
 181
181 -
182
-
183
-
184
-
185
-
186
-
187
-
188
-
189
-
190
-
191
-
192
-
193
-
194
-
195
-
196
-
197
-
198
-
199
-
200
-
201
-
202
-
203
-
204
-
205
-
206
-
207
-
208
-
209
-
210
-
211
-
212
-
213
-
214
-
215
-
216
-
217
-
218
-
219
-
220
-
221
-
222
-
223
-
224
-
225
-
226
-
227
-
228
-
229
-
230
-
231
-
232
-
233
-
234
-
235
-
236
-
237
-
238
-
239
-
240
-
241
-
242
-
243
-
244
-
245
-
246
-
247
-
248
 |
 |

THE HARTFORD FINANCIAL SERVICES GROUP, INC.
NOTES TO CONSOLIDATED FINANCIAL STATEMENTS (continued)
F-36
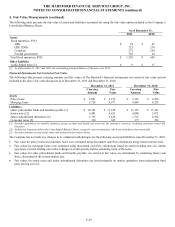
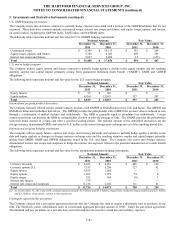
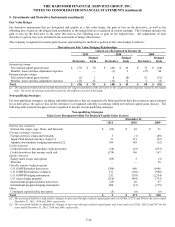
5. Investments and Derivative Instruments (continued)
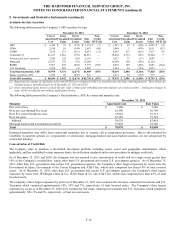
Available-for-Sale Securities
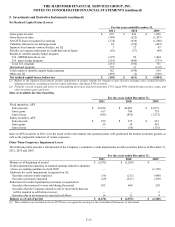
The following table presents the Company’ s AFS securities by type.
December 31, 2011
December 31, 2010
Cost or
Amortized
Cost
Gross
Unrealized
Gains
Gross
Unrealized
Losses
Fair
Value
Non-
Credit
OTTI [1]
Cost or
Amortized
Cost
Gross
Unrealized
Gains
Gross
Unrealized
Losses
Fair
Value
Non-
Credit
OTTI [1]
ABS $ 3,430
$
55
$
(332)
$
3,153 $ (7) $ 3,247 $ 38 $ (396) $ 2,889 $ (2)
CDOs
2,819
16
(348)
2,487
(44)
3,088
1
(478)
2,611
(82)
CMBS 7,192
271
(512)
6,951 (31) 8,297 235 (615) 7,917 (9)
Corporate [2]
41,161
3,661
(739)
44,011
—
38,496
2,174
(747)
39,884
7
Foreign govt./govt. agencies 2,030
141
(10)
2,161 — 1,627 73 (17) 1,683 —
Municipal
12,557
775
(72)
13,260
—
12,469
150
(495)
12,124
—
RMBS 5,961
252
(456)
5,757 (105) 6,036 109 (462) 5,683 (124)
U.S. Treasuries
3,828
203
(2)
4,029
—
5,159
24
(154)
5,029
—
Total fixed maturities, AFS
78,978
5,374
(2,471)
81,809
(187)
78,419
2,804
(3,364)
77,820
(210)
Equity securities, AFS 1,056
68
(203)
921 — 1,013 92 (132) 973 —
Total AFS securities
$
80,034
$
5,442
$
(2,674)
$
82,730
$
(187)
$
79,432
$
2,896
$
(3,496)
$
78,793
$
(210)
[1] Represents the amount of cumulative non-credit OTTI losses recognized in OCI on securities that also had credit impairments. These losses are
included in gross unrealized losses as of December 31, 2011 and 2010.
[2] Gross unrealized gains (losses) exclude the fair value of bifurcated embedded derivative features of certain securities. Subsequent changes in
value will be recorded in net realized capital gains (losses).
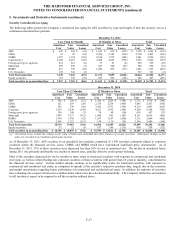
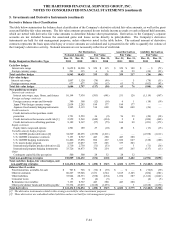
The following table presents the Company’ s fixed maturities, AFS, by contractual maturity year.
December 31, 2011
Maturity
Amortized Cost
Fair Value
One year or less
$
3,206
$
3,240
Over one year through five years
16,140
16,790
Over five years through ten years
15,041
16,111
Over ten years
25,189
27,320
Subtotal
59,576
63,461
Mortgage-backed and asset-backed securities
19,402
18,348
Total
$
78,978
$
81,809
Estimated maturities may differ from contractual maturities due to security call or prepayment provisions. Due to the potential for
variability in payment spreads (i.e. prepayments or extensions), mortgage-backed and asset-backed securities are not categorized by
contractual maturity.
Concentration of Credit Risk
The Company aims to maintain a diversified investment portfolio including issuer, sector and geographic stratification, where
applicable, and has established certain exposure limits, diversification standards and review procedures to mitigate credit risk.
As of December 31, 2011 and 2010, the Company was not exposed to any concentration of credit risk of a single issuer greater than
10% of the Company’ s stockholders’ equity other than U.S. government and certain U.S. government agencies. As of December 31,
2011, other than U.S. government and certain U.S. government agencies, the Company’ s three largest exposures by issuer were the
Government of Japan, Government of the United Kingdom and AT&T Inc. which each comprised less than 0.8% of total invested
assets. As of December 31, 2010, other than U.S. government and certain U.S. government agencies, the Company’ s three largest
exposures by issuer were JP Morgan Chase & Co., Wells Fargo & Co. and AT&T Inc. which each comprised less than 0.5% of total
invested assets.
The Company’ s three largest exposures by sector as of December 31, 2011 were commercial real estate, municipal investments and U.S.
Treasuries which comprised approximately 10%, 10% and 7%, respectively, of total invested assets. The Company’ s three largest
exposures by sector as of December 31, 2010 were commercial real estate, municipal investments and U.S. Treasuries which comprised
approximately 10%, 9% and 9%, respectively, of total invested assets.