The Hartford 2011 Annual Report Download - page 45
Download and view the complete annual report
Please find page 45 of the 2011 The Hartford annual report below. You can navigate through the pages in the report by either clicking on the pages listed below, or by using the keyword search tool below to find specific information within the annual report.-
 1
1 -
2
-
3
-
4
-
5
-
6
-
7
-
8
-
9
-
10
-
11
-
12
-
13
-
14
-
15
-
16
-
17
-
18
-
19
-
20
-
21
-
22
-
23
-
24
-
25
-
26
-
27
-
28
-
29
-
30
-
31
-
32
-
33
-
34
-
 35
35 -
 36
36 -
 37
37 -
 38
38 -
 39
39 -
 40
40 -
 41
41 -
 42
42 -
 43
43 -
 44
44 -
 45
45 -
 46
46 -
 47
47 -
 48
48 -
 49
49 -
 50
50 -
 51
51 -
 52
52 -
 53
53 -
 54
54 -
 55
55 -
56
-
57
-
58
-
59
-
60
-
61
-
62
-
63
-
64
-
65
-
66
-
67
-
68
-
69
-
70
-
71
-
72
-
73
-
74
-
75
-
76
-
77
-
78
-
79
-
80
-
81
-
82
-
83
-
84
-
85
-
86
-
87
-
88
-
89
-
90
-
91
-
92
-
93
-
94
-
95
-
96
-
97
-
98
-
99
-
100
-
101
-
102
-
103
-
104
-
105
-
106
-
107
-
108
-
109
-
110
-
111
-
112
-
113
-
114
-
115
-
116
-
117
-
118
-
119
-
120
-
121
-
122
-
123
-
124
-
125
-
126
-
127
-
128
-
129
-
130
-
131
-
132
-
133
-
134
-
135
-
136
-
137
-
138
-
139
-
140
-
141
-
142
-
143
-
144
-
145
-
146
-
147
-
148
-
149
-
150
-
151
-
152
-
153
-
154
-
155
-
156
-
157
-
158
-
159
-
160
-
161
-
162
-
163
-
164
-
165
-
166
-
167
-
168
-
169
-
170
-
171
-
172
-
173
-
174
-
175
-
176
-
177
-
178
-
179
-
180
-
181
-
182
-
183
-
184
-
185
-
186
-
187
-
188
-
189
-
190
-
191
-
192
-
193
-
194
-
195
-
196
-
197
-
198
-
199
-
200
-
201
-
202
-
203
-
204
-
205
-
206
-
207
-
208
-
209
-
210
-
211
-
212
-
213
-
214
-
215
-
216
-
217
-
218
-
219
-
220
-
221
-
222
-
223
-
224
-
225
-
226
-
227
-
228
-
229
-
230
-
231
-
232
-
233
-
234
-
235
-
236
-
237
-
238
-
239
-
240
-
241
-
242
-
243
-
244
-
245
-
246
-
247
-
248
 |
 |

45
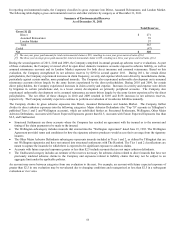
Total Property and Casualty Insurance Product Reserves, Net of Reinsurance, Results
In the opinion of management, based upon the known facts and current law, the reserves recorded for the Company’ s property and
casualty businesses at December 31, 2011 represent the Company’ s best estimate of its ultimate liability for losses and loss adjustment
expenses related to losses covered by policies written by the Company. However, because of the significant uncertainties surrounding
reserves, and particularly asbestos exposures, it is possible that management’ s estimate of the ultimate liabilities for these claims may
change and that the required adjustment to recorded reserves could exceed the currently recorded reserves by an amount that could be
material to the Company’ s results of operations, financial condition and liquidity.
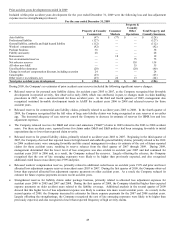
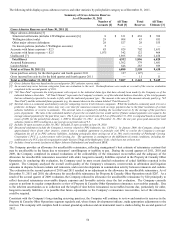
Reserve Roll-forwards and Development
Based on the results of the quarterly reserve review process, the Company determines the appropriate reserve adjustments, if any, to
record. Recorded reserve estimates are changed after consideration of numerous factors, including but not limited to, the magnitude of
the difference between the actuarial indication and the recorded reserves, improvement or deterioration of actuarial indications in the
period, the maturity of the accident year, trends observed over the recent past and the level of volatility within a particular line of
business. In general, adjustments are made more quickly to more mature accident years and less volatile lines of business. Such
adjustments of reserves are referred to as “reserve development”. Reserve development that increases previous estimates of ultimate
cost is called “reserve strengthening”. Reserve development that decreases previous estimates of ultimate cost is called “reserve
releases”. Reserve development can influence the comparability of year over year underwriting results and is set forth in the paragraphs
and tables that follow.
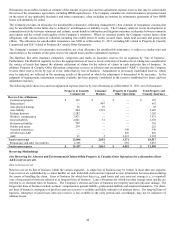
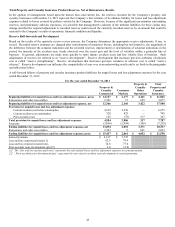
A roll-forward follows of property and casualty insurance product liabilities for unpaid losses and loss adjustment expenses for the year
ended December 31, 2011:
For the year ended December 31, 2011
Property &
Casualty
Commercial
Consumer
Markets
Property &
Casualty
Other
Operations
Total
Property and
Casualty
Insurance
Beginning liabilities for unpaid losses and loss adjustment expenses, gross
$
14,727
$
2,177
$
4,121
$
21,025
Reinsurance and other recoverables
2,361
17
699
3,077
Beginning liabilities for unpaid losses and loss adjustment expenses, net
12,366
2,160
3,422
17,948
Provision for unpaid losses and loss adjustment expenses
Current accident year before catastrophes
4,139
2,536
—
6,675
Current accident year catastrophes
320
425
—
745
Prior accident years
125
(75)
317
367
Total provision for unpaid losses and loss adjustment expenses
4,584
2,886
317
7,787
Payments
(3,856)
(2,994)
(368)
(7,218)
Ending liabilities for unpaid losses and loss adjustment expenses, net
13,094
2,052
3,371
18,517
Reinsurance and other recoverables
2,343
9
681
3,033
Ending liabilities for unpaid losses and loss adjustment expenses, gross
$
15,437
$
2,061
$
4,052
$
21,550
Earned premiums $
6,127
$
3,747
Loss and loss expense paid ratio [1]
62.9
79.9
Loss and loss expense incurred ratio
74.8
77.0
Prior accident years development (pts) [2]
2.0
(2.0)
[1] The “loss and loss expense paid ratio” represents the ratio of paid losses and loss adjustment expenses to earned premiums.
[2] “Prior accident years development (pts)” represents the ratio of prior accident years development to earned premiums.