The Hartford 2011 Annual Report Download - page 101
Download and view the complete annual report
Please find page 101 of the 2011 The Hartford annual report below. You can navigate through the pages in the report by either clicking on the pages listed below, or by using the keyword search tool below to find specific information within the annual report.-
 1
1 -
2
-
3
-
4
-
5
-
6
-
7
-
8
-
9
-
10
-
11
-
12
-
13
-
14
-
15
-
16
-
17
-
18
-
19
-
20
-
21
-
22
-
23
-
24
-
25
-
26
-
27
-
28
-
29
-
30
-
31
-
32
-
33
-
34
-
35
-
36
-
37
-
38
-
39
-
40
-
41
-
42
-
43
-
44
-
45
-
46
-
47
-
48
-
49
-
50
-
51
-
52
-
53
-
54
-
55
-
56
-
57
-
58
-
59
-
60
-
61
-
62
-
63
-
64
-
65
-
66
-
67
-
68
-
69
-
70
-
71
-
72
-
73
-
74
-
75
-
76
-
77
-
78
-
79
-
80
-
81
-
82
-
83
-
84
-
85
-
86
-
87
-
88
-
89
-
90
-
 91
91 -
 92
92 -
 93
93 -
 94
94 -
 95
95 -
 96
96 -
 97
97 -
 98
98 -
 99
99 -
 100
100 -
 101
101 -
 102
102 -
 103
103 -
 104
104 -
 105
105 -
 106
106 -
 107
107 -
 108
108 -
 109
109 -
 110
110 -
 111
111 -
112
-
113
-
114
-
115
-
116
-
117
-
118
-
119
-
120
-
121
-
122
-
123
-
124
-
125
-
126
-
127
-
128
-
129
-
130
-
131
-
132
-
133
-
134
-
135
-
136
-
137
-
138
-
139
-
140
-
141
-
142
-
143
-
144
-
145
-
146
-
147
-
148
-
149
-
150
-
151
-
152
-
153
-
154
-
155
-
156
-
157
-
158
-
159
-
160
-
161
-
162
-
163
-
164
-
165
-
166
-
167
-
168
-
169
-
170
-
171
-
172
-
173
-
174
-
175
-
176
-
177
-
178
-
179
-
180
-
181
-
182
-
183
-
184
-
185
-
186
-
187
-
188
-
189
-
190
-
191
-
192
-
193
-
194
-
195
-
196
-
197
-
198
-
199
-
200
-
201
-
202
-
203
-
204
-
205
-
206
-
207
-
208
-
209
-
210
-
211
-
212
-
213
-
214
-
215
-
216
-
217
-
218
-
219
-
220
-
221
-
222
-
223
-
224
-
225
-
226
-
227
-
228
-
229
-
230
-
231
-
232
-
233
-
234
-
235
-
236
-
237
-
238
-
239
-
240
-
241
-
242
-
243
-
244
-
245
-
246
-
247
-
248
 |
 |
101
To calculate duration, convexity, and key rate durations, projections of asset and liability cash flows are discounted to a present value
using interest rate assumptions. These cash flows are then revalued at alternative interest rate levels to determine the percentage change
in fair value due to an incremental change in the entire yield curve for duration and convexity, or a particular point on the yield curve for
key rate duration. Cash flows from corporate obligations are assumed to be consistent with the contractual payment streams on a yield
to worst basis. Yield to worst is a basis that represents the lowest potential yield that can be received without the issuer actually
defaulting. The primary assumptions used in calculating cash flow projections include expected asset payment streams taking into
account prepayment speeds, issuer call options and contract holder behavior. Mortgage-backed and asset-backed securities are modeled
based on estimates of the rate of future prepayments of principal over the remaining life of the securities. These estimates are developed
by incorporating collateral surveillance and anticipated future market dynamics. Actual prepayment experience may vary from these
estimates.
The Company is also exposed to interest rate risk based upon the discount rate assumption associated with the Company’ s pension and
other postretirement benefit obligations. The discount rate assumption is based upon an interest rate yield curve comprised of bonds
rated Aa with maturities primarily between zero and thirty years. For further discussion of interest rate risk associated with the benefit
obligations, see the Critical Accounting Estimates Section of the MD&A under Pension and Other Postretirement Benefit Obligations
and Note 17 of the Notes to Consolidated Financial Statements. In addition, management evaluates performance of certain Wealth
Management and Life Other Operations products based on net investment spread which is, in part, influenced by changes in interest
rates. For further discussion, see the Individual Annuity, Individual Life, and Retirement Plans sections of the MD&A.
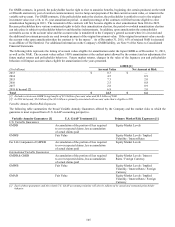
The investments and liabilities primarily associated with interest rate risk are included in the following discussion. Certain product
liabilities, including those containing GMWB, GMIB, GMAB, or GMDB, expose the Company to interest rate risk but also have
significant equity risk. These liabilities are discussed as part of the Equity Risk section below.
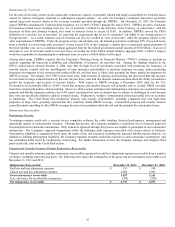
Fixed Maturity Investments
The Company’ s investment portfolios primarily consist of investment grade fixed maturity securities. The fair value of these
investments was $83.1 billion and $78.4 billion at December 31, 2011 and 2010, respectively. The fair value of these and other invested
assets fluctuates depending on the interest rate environment and other general economic conditions. The weighted average duration of
the fixed maturity portfolio was approximately 5.3 years and 5.1 years as of December 31, 2011 and 2010, respectively.
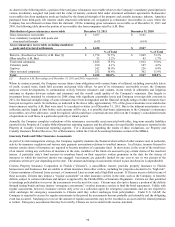
Liabilities
The Company’ s investment contracts and certain insurance product liabilities, other than non-guaranteed separate accounts, include
asset accumulation vehicles such as fixed annuities, guaranteed investment contracts, other investment and universal life-type contracts
and certain insurance products such as long-term disability.
Asset accumulation vehicles primarily require a fixed rate payment, often for a specified period of time, such as fixed rate annuities with
a market value adjustment feature. Product examples include fixed rate annuities with a market value adjustment feature and fixed rate
guaranteed investment contracts. The term to maturity of these contracts generally range from less than one year to ten years. In
addition, certain products such as universal life contracts and the general account portion of Wealth Management’ s and Life Other
Operation’ s variable annuity products, credit interest to policyholders subject to market conditions and minimum interest rate
guarantees. The term to maturity of the asset portfolio supporting these products may range from short to intermediate.
While interest rate risk associated with many of these products has been reduced through the use of market value adjustment features
and surrender charges, the primary risk associated with these products is that the spread between investment return and credited rate
may not be sufficient to earn targeted returns.
The Company also manages the risk of certain insurance liabilities similarly to investment type products due to the relative
predictability of the aggregate cash flow payment streams. Products in this category may contain significant reliance upon actuarial
(including mortality and morbidity) pricing assumptions and do have some element of cash flow uncertainty. Product examples include
structured settlement contracts, on-benefit annuities (i.e., the annuitant is currently receiving benefits thereon) and short-term and long-
term disability contracts. The cash outflows associated with these policy liabilities are not interest rate sensitive but do vary based on
the timing and amount of benefit payments. The primary risks associated with these products are that the benefits will exceed expected
actuarial pricing and/or that the actual timing of the cash flows will differ from those anticipated, or interest rate levels may deviate
from those assumed in product pricing, ultimately resulting in an investment return lower than that assumed in pricing. The average
duration of the liability cash flow payments can range from less than one year to in excess of fifteen years.
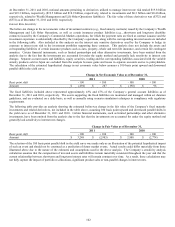
Derivatives
The Company utilizes a variety of derivative instruments to mitigate interest rate risk associated with its investment portfolio. Interest
rate swaps are primarily used to convert interest receipts or payments to a fixed or variable rate. The use of such swaps enables the
Company to customize contract terms and conditions to customer objectives and manage the interest rate risk profile within established
tolerances. Interest rate swaps are also used to hedge the variability in the cash flow of a forecasted purchase or sale of fixed rate
securities due to changes in interest rates. Forward rate agreements are used to convert interest receipts on floating-rate securities to
fixed rates. These derivatives are used to lock in the forward interest rate curve and reduce income volatility that results from changes
in interest rates. Interest rate caps, floors, swaptions, and futures may be used to manage portfolio duration.