Starwood 2012 Annual Report Download - page 71
Download and view the complete annual report
Please find page 71 of the 2012 Starwood annual report below. You can navigate through the pages in the report by either clicking on the pages listed below, or by using the keyword search tool below to find specific information within the annual report.-
 1
1 -
2
-
3
-
4
-
5
-
6
-
7
-
8
-
9
-
10
-
11
-
12
-
13
-
14
-
15
-
16
-
17
-
18
-
19
-
20
-
21
-
22
-
23
-
24
-
25
-
26
-
27
-
28
-
29
-
30
-
31
-
32
-
33
-
34
-
35
-
36
-
37
-
38
-
39
-
40
-
41
-
42
-
43
-
44
-
45
-
46
-
47
-
48
-
49
-
50
-
51
-
52
-
53
-
54
-
55
-
56
-
57
-
58
-
59
-
60
-
 61
61 -
 62
62 -
 63
63 -
 64
64 -
 65
65 -
 66
66 -
 67
67 -
 68
68 -
 69
69 -
 70
70 -
 71
71 -
 72
72 -
 73
73 -
 74
74 -
 75
75 -
 76
76 -
 77
77 -
 78
78 -
 79
79 -
 80
80 -
 81
81 -
82
-
83
-
84
-
85
-
86
-
87
-
88
-
89
-
90
-
91
-
92
-
93
-
94
-
95
-
96
-
97
-
98
-
99
-
100
-
101
-
102
-
103
-
104
-
105
-
106
-
107
-
108
-
109
-
110
-
111
-
112
-
113
-
114
-
115
-
116
-
117
-
118
-
119
-
120
-
121
-
122
-
123
-
124
-
125
-
126
-
127
-
128
-
129
-
130
-
131
-
132
-
133
-
134
-
135
-
136
-
137
-
138
-
139
-
140
-
141
-
142
-
143
-
144
-
145
-
146
-
147
-
148
-
149
-
150
-
151
-
152
-
153
-
154
-
155
-
156
-
157
-
158
-
159
-
160
-
161
-
162
-
163
-
164
-
165
-
166
-
167
-
168
-
169
-
170
-
171
-
172
-
173
-
174
-
175
-
176
-
177
-
178
-
179
-
180
-
181
-
182
-
183
-
184
-
185
-
186
-
187
-
188
-
189
-
190
-
191
-
192
-
193
-
194
-
195
-
196
-
197
-
198
-
199
-
200
-
201
-
202
-
203
-
204
-
205
-
206
-
207
-
208
-
209
-
210
 |
 |

STARWOOD HOTELS & RESORTS WORLDWIDE, INC.-2013Proxy Statement 65
EXECUTIVE COMPENSATION
Equity Grant
In 2012, each Non-Employee Director received an annual equity
grant (made at the same time as the annual grant is made to
Company employees) under our LTIP with a value of $125,000.
The equity grant was delivered 50% in restricted stock units and
50% in stock options. The number of restricted stock units is
determined by dividing the award value by the fair market value
of our stock on the date of grant (fair market value is calculated
as the average of the high and low share price on such date). The
number of options is determined by dividing the award value by
the fair market value of our stock on the date of grant (fair market
value is calculated as the average of the high and low share price
on such date) and multiplying by two and one-half, which we
believe historically approximates the number of options determined
through formal lattice model option valuation. The options are fully
vested and exercisable upon grant and are scheduled to expire
eight years after the grant date. The restricted stock units awarded
pursuant to the annual grant generally vest in full upon the earlier
of (1)the third anniversary of the grant date and (2)the date such
person ceases to be a director of the Company.
Starwood Preferred Guest Program Points and Rooms
In 2012, each Non-Employee Director received an annual grant of 750,000 SPG points to encourage them to visit and personally
evaluate our properties.
Other Compensation
We reimburse Non-Employee Directors for travel expenses, other out-of-pocket costs they incur when attending meetings and, for one
meeting per year, expenses related to attendance by spouses.
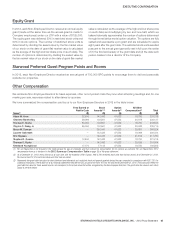
We have summarized the compensation paid by us to our Non-Employee Directors in 2012 in the table below.
Name(1)
Fees Earned or
Paid in Cash
($)
Stock
Awards(2) (3)
($)
Option
Awards(4)
($)
All Other
Compensation(5)
($) Total
($)
Adam M. Aron 22,500 142,433 47,532 18,750 231,215
Charlene Barshefsky 59,066 102,561 47,532 24,978 234,137
Thomas E. Clarke 50,000 102,561 47,532 18,750 218,843
Clayton C. Daley, Jr. 65,000 102,561 47,532 20,626 235,719
Bruce W. Duncan — 292,441 47,532 20,651 360,624
Lizanne Galbreath — 142,433 47,532 19,369 209,334
Eric Hippeau — 142,433 47,532 21,815 211,780
Stephen R. Quazzo 12,500 142,433 47,532 18,750 221,215
Thomas O. Ryder — 142,433 47,532 20,639 210,604
Kneeland Youngblood 17,170 77,143 47,532 18,750 160,595
(1) Mr.van Paasschen is not included in this table because he was an employee and thus received no compensation for his services as a director. Mr.van Paasschen’s 2012
compensation from us is disclosed in the 2012 Summary Compensation Table on page55 of this proxy statement.
(2) As of December31, 2012, every director as of such date, with the exception of Mr.Duncan, held 3,790 restricted stock units that had not vested. As of December31, 2012,
Mr.Duncan held 13,410 restricted stock units that had not vested.
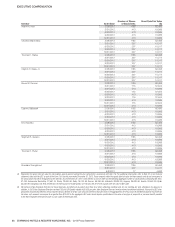
(3) Represents the grant date fair value for stock (deferred and otherwise) and restricted stock unit awards granted during the year computed in accordance with ASC718. For
additional information, refer to Note22 of our financial statements filed with the SEC as part of the Form10-K for the year ended December31, 2012. These amounts reflect the
grant date fair value for these awards and do not correspond to the actual value that will be recognized by the Non-Employee Directors. The grant date fair value of each stock
award is set forth below: