Starwood 2012 Annual Report Download - page 176
Download and view the complete annual report
Please find page 176 of the 2012 Starwood annual report below. You can navigate through the pages in the report by either clicking on the pages listed below, or by using the keyword search tool below to find specific information within the annual report.-
 1
1 -
2
-
3
-
4
-
5
-
6
-
7
-
8
-
9
-
10
-
11
-
12
-
13
-
14
-
15
-
16
-
17
-
18
-
19
-
20
-
21
-
22
-
23
-
24
-
25
-
26
-
27
-
28
-
29
-
30
-
31
-
32
-
33
-
34
-
35
-
36
-
37
-
38
-
39
-
40
-
41
-
42
-
43
-
44
-
45
-
46
-
47
-
48
-
49
-
50
-
51
-
52
-
53
-
54
-
55
-
56
-
57
-
58
-
59
-
60
-
61
-
62
-
63
-
64
-
65
-
66
-
67
-
68
-
69
-
70
-
71
-
72
-
73
-
74
-
75
-
76
-
77
-
78
-
79
-
80
-
81
-
82
-
83
-
84
-
85
-
86
-
87
-
88
-
89
-
90
-
91
-
92
-
93
-
94
-
95
-
96
-
97
-
98
-
99
-
100
-
101
-
102
-
103
-
104
-
105
-
106
-
107
-
108
-
109
-
110
-
111
-
112
-
113
-
114
-
115
-
116
-
117
-
118
-
119
-
120
-
121
-
122
-
123
-
124
-
125
-
126
-
127
-
128
-
129
-
130
-
131
-
132
-
133
-
134
-
135
-
136
-
137
-
138
-
139
-
140
-
141
-
142
-
143
-
144
-
145
-
146
-
147
-
148
-
149
-
150
-
151
-
152
-
153
-
154
-
155
-
156
-
157
-
158
-
159
-
160
-
161
-
162
-
163
-
164
-
165
-
 166
166 -
 167
167 -
 168
168 -
 169
169 -
 170
170 -
 171
171 -
 172
172 -
 173
173 -
 174
174 -
 175
175 -
 176
176 -
 177
177 -
 178
178 -
 179
179 -
 180
180 -
 181
181 -
 182
182 -
 183
183 -
 184
184 -
 185
185 -
 186
186 -
187
-
188
-
189
-
190
-
191
-
192
-
193
-
194
-
195
-
196
-
197
-
198
-
199
-
200
-
201
-
202
-
203
-
204
-
205
-
206
-
207
-
208
-
209
-
210
 |
 |

STARWOOD HOTELS & RESORTS WORLDWIDE, INC.
NOTES TO FINANCIAL STATEMENTS
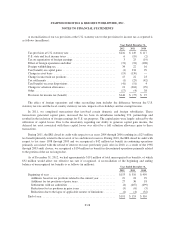
During the year ended December 31, 2010, we recorded a net loss on dispositions of approximately $39
million, primarily related to a $53 million loss on the sale of one wholly-owned hotel subject to a long-term
management contract and a $4 million impairment of fixed assets that are being retired in connection with a
significant renovation of a wholly-owned hotel. These charges were partially offset by a gain of $14 million from
insurance proceeds received for a claim at a wholly-owned hotel that suffered damage from a storm, a $5 million
gain as a result of an acquisition of a controlling interest in a joint venture in which we previously held a non-
controlling interest (see Note 4) and a $4 million gain from the sale of non-hotel assets.
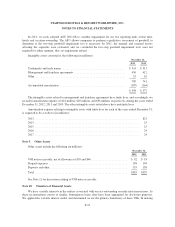
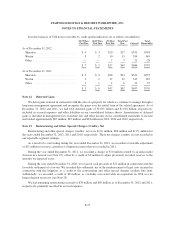
During the years ended December 31, 2012, 2011 and 2010, we reviewed the recoverability of the carrying
values of our owned hotels and determined that certain hotels or hotel assets were impaired. The fair values of
the hotels were estimated primarily from discounted cash flows models. Impairment charges totaling $2 million,
$7 million and $2 million, relating to two, six and one hotels, were recorded in the years ended December 31,
2012, 2011 and 2010, respectively, and to the following segment asset groups (in millions):
Year Ended December 31,
2012 2011 2010
Americas ...................................................... $— $5 $ 2
EAME ........................................................ 2 2 —
Total ........................................................ $ 2 $7 $ 2
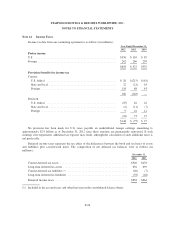
Note 6. Assets Held for Sale
During the year ended December 31, 2012, we entered into a purchase and sale agreement for the sale of
certain wholly-owned hotels. We received a non-refundable deposit during the fourth quarter of 2012, and the
hotels and estimated goodwill of $4 million expected to be allocated to these assets have been reclassified as
assets held for sale as of December 31, 2012 and 2011. In connection with the anticipated sales, we recognized
an impairment charge of $4 million recorded to the gain (loss) on asset dispositions and impairments, net, line
item to reflect the fair market value of the properties based on the current market price less costs to sell. The sales
of these hotels, which are encumbered by franchise agreements, closed in January 2013, and we received gross
cash proceeds of approximately $36 million.
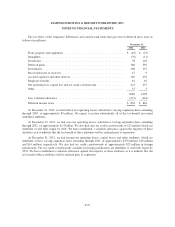
Note 7. Plant, Property and Equipment
Plant, property and equipment consisted of the following (in millions):
December 31,
2012 2011
Land and improvements ............................................. $ 554 $ 612
Buildings and improvements ......................................... 2,985 3,031
Furniture, fixtures and equipment ..................................... 1,876 1,852
Construction work in process ......................................... 169 244
5,584 5,739
Less accumulated depreciation and amortization .......................... (2,422) (2,507)
$ 3,162 $ 3,232
F-19