Starwood 2012 Annual Report Download - page 203
Download and view the complete annual report
Please find page 203 of the 2012 Starwood annual report below. You can navigate through the pages in the report by either clicking on the pages listed below, or by using the keyword search tool below to find specific information within the annual report.-
 1
1 -
2
-
3
-
4
-
5
-
6
-
7
-
8
-
9
-
10
-
11
-
12
-
13
-
14
-
15
-
16
-
17
-
18
-
19
-
20
-
21
-
22
-
23
-
24
-
25
-
26
-
27
-
28
-
29
-
30
-
31
-
32
-
33
-
34
-
35
-
36
-
37
-
38
-
39
-
40
-
41
-
42
-
43
-
44
-
45
-
46
-
47
-
48
-
49
-
50
-
51
-
52
-
53
-
54
-
55
-
56
-
57
-
58
-
59
-
60
-
61
-
62
-
63
-
64
-
65
-
66
-
67
-
68
-
69
-
70
-
71
-
72
-
73
-
74
-
75
-
76
-
77
-
78
-
79
-
80
-
81
-
82
-
83
-
84
-
85
-
86
-
87
-
88
-
89
-
90
-
91
-
92
-
93
-
94
-
95
-
96
-
97
-
98
-
99
-
100
-
101
-
102
-
103
-
104
-
105
-
106
-
107
-
108
-
109
-
110
-
111
-
112
-
113
-
114
-
115
-
116
-
117
-
118
-
119
-
120
-
121
-
122
-
123
-
124
-
125
-
126
-
127
-
128
-
129
-
130
-
131
-
132
-
133
-
134
-
135
-
136
-
137
-
138
-
139
-
140
-
141
-
142
-
143
-
144
-
145
-
146
-
147
-
148
-
149
-
150
-
151
-
152
-
153
-
154
-
155
-
156
-
157
-
158
-
159
-
160
-
161
-
162
-
163
-
164
-
165
-
166
-
167
-
168
-
169
-
170
-
171
-
172
-
173
-
174
-
175
-
176
-
177
-
178
-
179
-
180
-
181
-
182
-
183
-
184
-
185
-
186
-
187
-
188
-
189
-
190
-
191
-
192
-
 193
193 -
 194
194 -
 195
195 -
 196
196 -
 197
197 -
 198
198 -
 199
199 -
 200
200 -
 201
201 -
 202
202 -
 203
203 -
 204
204 -
 205
205 -
 206
206 -
 207
207 -
 208
208 -
 209
209 -
 210
210
 |
 |
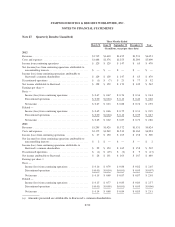
STARWOOD HOTELS & RESORTS WORLDWIDE, INC.
NOTES TO FINANCIAL STATEMENTS
environmental costs during the ordinary course of operations, we anticipate that such costs will not have a
material adverse effect on our operations or financial condition.
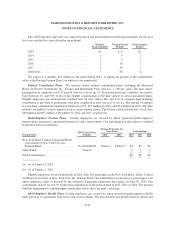
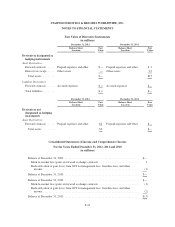
Captive Insurance Company. Estimated insurance claims payable at December 31, 2012 and 2011 were
$68 million and $70 million, respectively. At December 31, 2012 and 2011, standby letters of credit amounting
to $59 million and $60 million, respectively, had been issued to provide collateral for the estimated claims. We
guarantee the letters of credit.
ITT Industries. In 1995, the former ITT Corporation, renamed ITT Industries, Inc. (“ITT Industries”),
distributed to its stockholders all of the outstanding shares of common stock of ITT Corporation, then a wholly
owned subsidiary of ITT Industries (the “Distribution”). In connection with this Distribution, ITT Corporation,
which was then named ITT Destinations, Inc., changed its name to ITT Corporation. Subsequent to the
acquisition of ITT Corporation in 1998, we changed the name of ITT Corporation to Sheraton Holding
Corporation.
For purposes of governing certain of the ongoing relationships between us and ITT Industries after the
Distribution and spin-off of ITT Corporation and to provide for an orderly transition, we have entered into
various agreements with ITT Industries. These agreements include a spin-off agreement, Employee Benefits
Services and Liability Agreement, Tax Allocation Agreement and Intellectual Property Transfer and License
Agreements. We may be liable to or due reimbursement from ITT Industries relating to the resolution of certain
pre-spin-off matters under these agreements. Based on available information, management does not believe that
these matters would have a material impact on our consolidated results of operations, financial position or cash
flows. During the year ended December 31, 2012, we recorded a gain in discontinued operations, net of
$23 million (net of tax) from the favorable settlement of certain liabilities associated with a former subsidiary of
ITT Corporation (see Note 18). During the year ended December 31, 2010, we reversed a liability related to the
1998 acquisition (see Note 13).
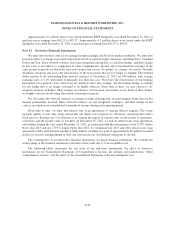
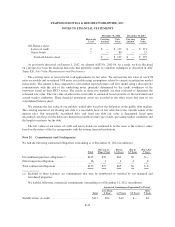
Note 26. Business Segment Information
On July 1, 2012, we completed an internal management reorganization related to our former hotel segment.
Whereas our hotel business had previously been included in a single reportable segment, as a result of this
reorganization, these results are now segregated into three separate hotel segments: (i) the Americas, (ii) EAME,
and (iii) Asia Pacific. The vacation ownership and residential business remains a separate segment. Prior period
data was restated to be consistent with the current year presentation.
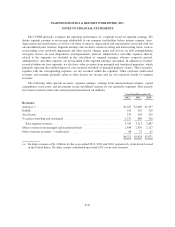
Our reportable segments each have a division president who is responsible for the management of the
division. Each division president reports directly to our Chief Executive Officer who is also the Chief Operating
Decision Maker (“CODM”). Financial information for each reportable segment is reviewed by the CODM to
assess performance and make decisions regarding the allocation of resources.
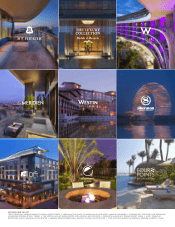
Each hotel segment generates its earnings through a network of owned, leased, consolidated and
unconsolidated joint venture hotels and resorts operated primarily under our proprietary brand names including
St. Regis®, The Luxury Collection®,W
®, Westin®, Le Méridien®, Sheraton®, Four Points®by Sheraton, Aloft®,
and Element®, and as well as hotels and resorts which are managed or franchised under these brand names in
exchange for fees.
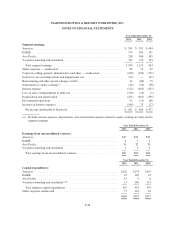
The management of our vacation ownership and residential sales business is conducted by the vacation
ownership and residential segment. The vacation ownership and residential segment generates its earnings
through the acquisition, development and operation of vacation ownership resorts, marketing and selling of
VOIs, and providing financing to customers who purchase such interests.
F-46