Starwood 2012 Annual Report Download - page 198
Download and view the complete annual report
Please find page 198 of the 2012 Starwood annual report below. You can navigate through the pages in the report by either clicking on the pages listed below, or by using the keyword search tool below to find specific information within the annual report.-
 1
1 -
2
-
3
-
4
-
5
-
6
-
7
-
8
-
9
-
10
-
11
-
12
-
13
-
14
-
15
-
16
-
17
-
18
-
19
-
20
-
21
-
22
-
23
-
24
-
25
-
26
-
27
-
28
-
29
-
30
-
31
-
32
-
33
-
34
-
35
-
36
-
37
-
38
-
39
-
40
-
41
-
42
-
43
-
44
-
45
-
46
-
47
-
48
-
49
-
50
-
51
-
52
-
53
-
54
-
55
-
56
-
57
-
58
-
59
-
60
-
61
-
62
-
63
-
64
-
65
-
66
-
67
-
68
-
69
-
70
-
71
-
72
-
73
-
74
-
75
-
76
-
77
-
78
-
79
-
80
-
81
-
82
-
83
-
84
-
85
-
86
-
87
-
88
-
89
-
90
-
91
-
92
-
93
-
94
-
95
-
96
-
97
-
98
-
99
-
100
-
101
-
102
-
103
-
104
-
105
-
106
-
107
-
108
-
109
-
110
-
111
-
112
-
113
-
114
-
115
-
116
-
117
-
118
-
119
-
120
-
121
-
122
-
123
-
124
-
125
-
126
-
127
-
128
-
129
-
130
-
131
-
132
-
133
-
134
-
135
-
136
-
137
-
138
-
139
-
140
-
141
-
142
-
143
-
144
-
145
-
146
-
147
-
148
-
149
-
150
-
151
-
152
-
153
-
154
-
155
-
156
-
157
-
158
-
159
-
160
-
161
-
162
-
163
-
164
-
165
-
166
-
167
-
168
-
169
-
170
-
171
-
172
-
173
-
174
-
175
-
176
-
177
-
178
-
179
-
180
-
181
-
182
-
183
-
184
-
185
-
186
-
187
-
 188
188 -
 189
189 -
 190
190 -
 191
191 -
 192
192 -
 193
193 -
 194
194 -
 195
195 -
 196
196 -
 197
197 -
 198
198 -
 199
199 -
 200
200 -
 201
201 -
 202
202 -
 203
203 -
 204
204 -
 205
205 -
 206
206 -
 207
207 -
 208
208 -
209
-
210
 |
 |

STARWOOD HOTELS & RESORTS WORLDWIDE, INC.
NOTES TO FINANCIAL STATEMENTS
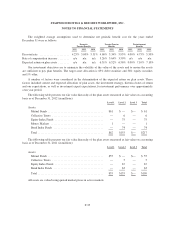
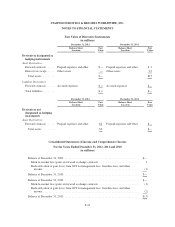
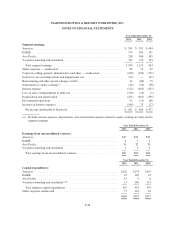
Fair Value of Derivative Instruments
(in millions)
December 31, 2012 December 31, 2011
Balance Sheet
Location
Fair
Value
Balance Sheet
Location
Fair
Value
Derivatives designated as
hedging instruments
Asset Derivatives
Forward contracts ..... Prepaid expenses and other $— Prepaid expenses and other $ 3
Interest rate swaps ..... Other assets — Other assets 12
Total assets ........ $— $15
Liability Derivatives
Forward contracts ..... Accrued expenses $ 1 Accrued expenses $—
Total liabilities ........ $ 1 $—
December 31, 2012 December 31, 2011
Balance Sheet
Location
Fair
Value
Balance Sheet
Location
Fair
Value
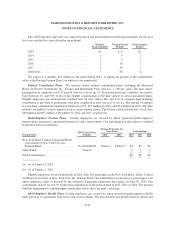
Derivatives not
designated as hedging
instruments
Asset Derivatives
Forward contracts ..... Prepaid expenses and other $2 Prepaid expenses and other $—
Total assets ........ $2 $—
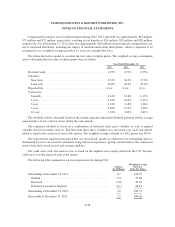
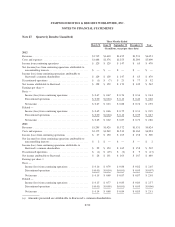
Consolidated Statements of Income and Comprehensive Income
For the Years Ended December 31, 2012, 2011 and 2010
(in millions)
Balance at December 31, 2009 .................................................... $—
Mark-to-market loss (gain) on forward exchange contracts ............................ 1
Reclassification of gain (loss) from OCI to management fees, franchise fees, and other
income ................................................................... (1)
Balance at December 31, 2010 .................................................... $—
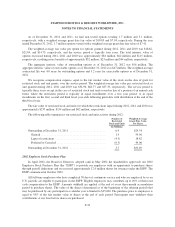
Balance at December 31, 2010 .................................................... $—
Mark-to-market loss (gain) on forward exchange contracts ............................ (1)
Reclassification of gain (loss) from OCI to management fees, franchise fees, and other
income ................................................................... (2)
Balance at December 31, 2011 .................................................... $(3)
F-41