Starwood 2012 Annual Report Download - page 44
Download and view the complete annual report
Please find page 44 of the 2012 Starwood annual report below. You can navigate through the pages in the report by either clicking on the pages listed below, or by using the keyword search tool below to find specific information within the annual report.-
 1
1 -
2
-
3
-
4
-
5
-
6
-
7
-
8
-
9
-
10
-
11
-
12
-
13
-
14
-
15
-
16
-
17
-
18
-
19
-
20
-
21
-
22
-
23
-
24
-
25
-
26
-
27
-
28
-
29
-
30
-
31
-
32
-
33
-
 34
34 -
 35
35 -
 36
36 -
 37
37 -
 38
38 -
 39
39 -
 40
40 -
 41
41 -
 42
42 -
 43
43 -
 44
44 -
 45
45 -
 46
46 -
 47
47 -
 48
48 -
 49
49 -
 50
50 -
 51
51 -
 52
52 -
 53
53 -
 54
54 -
55
-
56
-
57
-
58
-
59
-
60
-
61
-
62
-
63
-
64
-
65
-
66
-
67
-
68
-
69
-
70
-
71
-
72
-
73
-
74
-
75
-
76
-
77
-
78
-
79
-
80
-
81
-
82
-
83
-
84
-
85
-
86
-
87
-
88
-
89
-
90
-
91
-
92
-
93
-
94
-
95
-
96
-
97
-
98
-
99
-
100
-
101
-
102
-
103
-
104
-
105
-
106
-
107
-
108
-
109
-
110
-
111
-
112
-
113
-
114
-
115
-
116
-
117
-
118
-
119
-
120
-
121
-
122
-
123
-
124
-
125
-
126
-
127
-
128
-
129
-
130
-
131
-
132
-
133
-
134
-
135
-
136
-
137
-
138
-
139
-
140
-
141
-
142
-
143
-
144
-
145
-
146
-
147
-
148
-
149
-
150
-
151
-
152
-
153
-
154
-
155
-
156
-
157
-
158
-
159
-
160
-
161
-
162
-
163
-
164
-
165
-
166
-
167
-
168
-
169
-
170
-
171
-
172
-
173
-
174
-
175
-
176
-
177
-
178
-
179
-
180
-
181
-
182
-
183
-
184
-
185
-
186
-
187
-
188
-
189
-
190
-
191
-
192
-
193
-
194
-
195
-
196
-
197
-
198
-
199
-
200
-
201
-
202
-
203
-
204
-
205
-
206
-
207
-
208
-
209
-
210
 |
 |
STARWOOD HOTELS & RESORTS WORLDWIDE, INC.-2013Proxy Statement38
EXECUTIVE COMPENSATION
on an annual basis. In the course of this review, the Compensation
Committee considers our current compensation programs and
whether to modify them or introduce new programs to better meet
our overall compensation objectives.
Key highlights of our executive compensation program for fi scal
2012 included:
•
Base Salaries—Mr. van Paasschen did not receive an increase
in base salary in fi scal 2012. The base salaries of most other
named executive offi cers increased based on an annual merit
increase of 2% compared to fi scal 2011. These increases were
specifi cally approved to more closely align these offi cers’ salaries
with the median base salary of executives at peer companies.
Due to a mid-year promotion, Mr. Rivera’s salary increased by
an additional amount of less than 5% in July 2012.
•
Discretionary Payment—Mr. Siegel received a lump sum cash
payment equal in value to an annual merit increase of 2% of his
base salary in fi scal 2012. This lump sum payment was provided
instead of a salary increase.
•
Incentive Pay Largely Contingent Upon Our Performance—
Seventy-fi ve percent of our named executive offi cers’ total target
annual cash incentive opportunity was tied to our 2012 fi nancial
results, representing no change in philosophy compared to fi scal
2011. Payout eligibility for the company fi nancial portion of the
annual bonus was 92% for 2012 compared to 98% for 2011.
Annual incentive payments for performance in 2012 (paid in 2013)
were made 100% in cash, compared to our program in 2011
during which 25% was compulsorily deferred into restricted stock
units. This change was introduced in conjunction with the more
signifi cant changes to the company’s equity incentive program
being introduced in 2013 (more detail is provided in the section
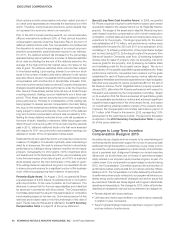
entitled Changes to Long-Term Incentive Compensation
Design in 2013 beginning on page 48 of this proxy statement).
•
Special Long-Term Cash Incentive Award—In 2012, Mr.
Rivera received a payout of $1.1 million in settlement of a
special long-term cash incentive award originally granted to him
in 2009. This award was designed to reward Mr. Rivera for his
work during 2010 and 2011 in helping us achieve qualitative
and quantitative performance goals related to our St. Regis Bal
Harbour property. Although the target payout for this award
was $1.0 million, the Board paid Mr. Rivera at 110% of target
due to exceptional fi nancial results that beat expectations,
signifi cant outperformance against all payment terms and
overwhelming external positive reviews of the property since
it opened. Achievement of the performance metrics for this
award related to: (1) achieving construction of the project below
budget and on time; (2) funding all costs of the property from
Starwood Vacation Ownership cash fl ow; (3) achieving budgeted
close rates for sales of property units; (4) exceeding mid-2012
revenue goals for the property; and (5) keeping cumulative sales
and marketing costs for the property below target.
•
Modest Increase in Equity Grants—The total equity grants
made to our named executive offi cers increased by less than
5% when compared to fi scal 2011.
•
Pay Mix Geared Towards Variable Compensation—The
proportion of the CEO’s total compensation that was variable
was 86% in fi scal 2012, unchanged from fi scal 2011.
•
Elimination of Future Tax Gross-Ups—In line with market best
practice, the Compensation Committee agreed in 2012 that we
will no longer provide tax gross-ups other than those required to
be paid under existing employment agreements. In addition, Mr.
van Paasschen’s employment agreement renewal, discussed in
the section entitled New 2013 Employment Agreement with Mr.
van Paasschen beginning on page 50 of this proxy statement,
will not provide for any excise tax gross-up.
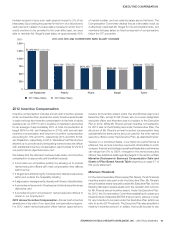
2012 Pay for Performance Analysis
Although 2012 continued to present global economic uncertainty
in many markets, we saw signs of stronger demand growth for the
global high-end lodging industry. As noted above, our business
and operating results for the year ended December 31, 2012
were strong, but our key pay decisions remained refl ective of the
global uncertainty and our Company’s intention to achieve stronger
operating and business results in 2013 and beyond.
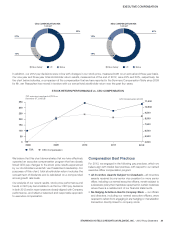
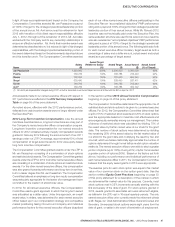
As discussed further below and refl ected in the following pay
mix charts, for 2012, once again an overwhelming portion of the
compensation for our named executive offi cers was tied to either
our fi nancial performance or potential increases in our stock price.
As a result, total compensation for 2012 for the named executive
offi cers was designed to increase as our performance goals were
achieved and as our stock price increased. The pay results for our
named executive offi cers, especially their annual incentive payouts
received at 92% of target and equity awards, refl ect our strong (but
capable of improvement) fi nancial and operating results. Because
of rounding, percentages may not add up to 100%.