Starwood 2012 Annual Report Download - page 12
Download and view the complete annual report
Please find page 12 of the 2012 Starwood annual report below. You can navigate through the pages in the report by either clicking on the pages listed below, or by using the keyword search tool below to find specific information within the annual report.-
 1
1 -
 2
2 -
 3
3 -
 4
4 -
 5
5 -
 6
6 -
 7
7 -
 8
8 -
 9
9 -
 10
10 -
 11
11 -
 12
12 -
 13
13 -
 14
14 -
 15
15 -
 16
16 -
 17
17 -
 18
18 -
 19
19 -
 20
20 -
 21
21 -
 22
22 -
23
-
24
-
25
-
26
-
27
-
28
-
29
-
30
-
31
-
32
-
33
-
34
-
35
-
36
-
37
-
38
-
39
-
40
-
41
-
42
-
43
-
44
-
45
-
46
-
47
-
48
-
49
-
50
-
51
-
52
-
53
-
54
-
55
-
56
-
57
-
58
-
59
-
60
-
61
-
62
-
63
-
64
-
65
-
66
-
67
-
68
-
69
-
70
-
71
-
72
-
73
-
74
-
75
-
76
-
77
-
78
-
79
-
80
-
81
-
82
-
83
-
84
-
85
-
86
-
87
-
88
-
89
-
90
-
91
-
92
-
93
-
94
-
95
-
96
-
97
-
98
-
99
-
100
-
101
-
102
-
103
-
104
-
105
-
106
-
107
-
108
-
109
-
110
-
111
-
112
-
113
-
114
-
115
-
116
-
117
-
118
-
119
-
120
-
121
-
122
-
123
-
124
-
125
-
126
-
127
-
128
-
129
-
130
-
131
-
132
-
133
-
134
-
135
-
136
-
137
-
138
-
139
-
140
-
141
-
142
-
143
-
144
-
145
-
146
-
147
-
148
-
149
-
150
-
151
-
152
-
153
-
154
-
155
-
156
-
157
-
158
-
159
-
160
-
161
-
162
-
163
-
164
-
165
-
166
-
167
-
168
-
169
-
170
-
171
-
172
-
173
-
174
-
175
-
176
-
177
-
178
-
179
-
180
-
181
-
182
-
183
-
184
-
185
-
186
-
187
-
188
-
189
-
190
-
191
-
192
-
193
-
194
-
195
-
196
-
197
-
198
-
199
-
200
-
201
-
202
-
203
-
204
-
205
-
206
-
207
-
208
-
209
-
210
 |
 |

STARWOOD HOTELS & RESORTS WORLDWIDE, INC.-2013Proxy Statement6
PROXY SUMMARY
Named Executive Offi cer Compensation (page37 )
Philosophy and Objectives (page 40 )
As a consumer lifestyle company with a branded hotel portfolio
at its core, we operate in a competitive, dynamic and challenging
business environment. In step with this mission and environment,
the key objectives for our compensation program for our named
executive offi cers for 2012 were to (1) attract and retain talented
executives from within and outside the hospitality industry who
understand the importance of innovation, brand enhancement and
consumer experience, (2) motivate our executives to sustain high
performance and achieve our fi nancial and strategic/operational/
leadership goals (without encouraging excessive risk taking), and (3)
align the investment interests of stockholders and the compensation
interests of our executives by linking executive compensation
to our annual business results and stock performance. More
specifi cally, our compensation program for our named executive
offi cers was designed to achieve:
•
Alignment with Stockholders – Signifi cant equity incentives with
stock ownership guidelines help ensure long-term compensation
is strongly linked to stockholder returns.
•Achievement of Company Financial Objectives – A portion
of named executive offi cer compensation is tied directly to our
fi nancial performance.
•
Achievement of Strategic/Operational/Leadership Objectives
– A portion of our named executive offi cer compensation depends
on the achievement of specifi c individual objectives that align with
the execution of our business strategy, as well as demonstrated
performance tied to our core leadership competencies that
include team building and the development of future talent.
2012 Compensation Highlights (page 37 )
Key highlights of our named executive offi cer compensation
program for fi scal 2012 included:
•
Base Salaries – Mr. van Paasschen did not receive an increase in
base salary in fi scal 2012. The base salaries of most other named
executive offi cers increased to more closely align these offi cers’
salaries with the median base salary of executives at peer companies.
•
Incentive Pay Largely Contingent Upon Our Performance
– Seventy-fi vepercent of our named executive offi cers’ total
target annual cash incentive opportunity was tied to our 2012
fi nancial results, representing no change in philosophy compared
to fi scal 2011.
•
Special Long-Term Cash Incentive Award – Mr. Rivera
received a payout of $1.1 million in settlement of a special
long-term cash incentive award originally granted to him in
2009 regarding our St. Regis Bal Harbour property. Although
the target payout for this award was $1.0 million, the Board paid
Mr. Rivera at 110% of target due to exceptional fi nancial results
that beat expectations, signifi cant outperformance against all
payment terms and overwhelming external positive reviews of
the property since it opened.
•
Modest Increase in Equity Grants – The total equity grants
made to our named executive offi cers increased by less than
5% when compared to fi scal 2011.
•
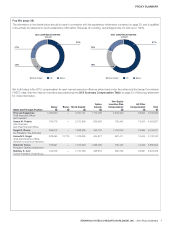
Pay Mix Geared Towards Variable Compensation – The
proportion of the CEO’s total compensation that was variable
was 86% in fi scal 2012, unchanged from fi scal 2011.
Elimination of Future Tax Gross-Ups—In line with market best
practice, the Compensation Committee agreed in 2012 that we
will no longer provide tax gross-ups other than those required to
be paid under existing employment agreements. In addition, Mr.
van Paasschen’s employment agreement renewal, discussed in
the section entitled New 2013 Employment Agreement with Mr.
van Paasschen beginning on page 50 of this proxy statement,
will not provide for any excise tax gross-up.
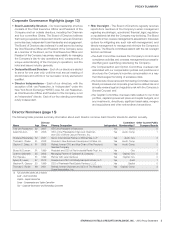
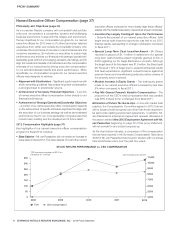
As the chart below indicates, a comparison of the compensation
that we have reported in the Summary Compensation Table since
2009 for Mr. van Paasschen has moved in tandem with our annual
total stockholder return over the past four years:
TSR CEO Compensation
STOCK RETURN PERFORMANCE vs. CEO COMPENSATION
2008 2010
2009 2012
2011
0
50
100
150
200
250
300
350
TSR assuming investment of $100 on
December 31, 2008 ($) CEO Compensation ($ 000)
4,500
5,500
6,500
7,500
8,500
9,500
10,500
11,500